
QtoTakeoff
Complete Documentation — every feature, every dialog, every panel, explained end to end for construction estimators taking quantities off PDF drawings.
★Overview — What is QtoTakeoff?
QtoTakeoff is a desktop application for construction quantity takeoff — measuring counts, lengths, areas, and volumes directly off PDF drawings, and turning those measurements into usable numbers: a Takeoff Summary, an Excel workbook, or a full Bill of Quantities (BOQ) with rates and amounts.
It runs entirely on your own computer. There is no internet connection required to use it, no cloud account, and no data of yours ever leaves your machine — see Legal — Privacy Policy for the full statement on this.
At a glance, a typical session looks like this:
- Import a PDF drawing set — each page becomes a Sheet.
- Calibrate each sheet's real-world scale once (Set Scale).
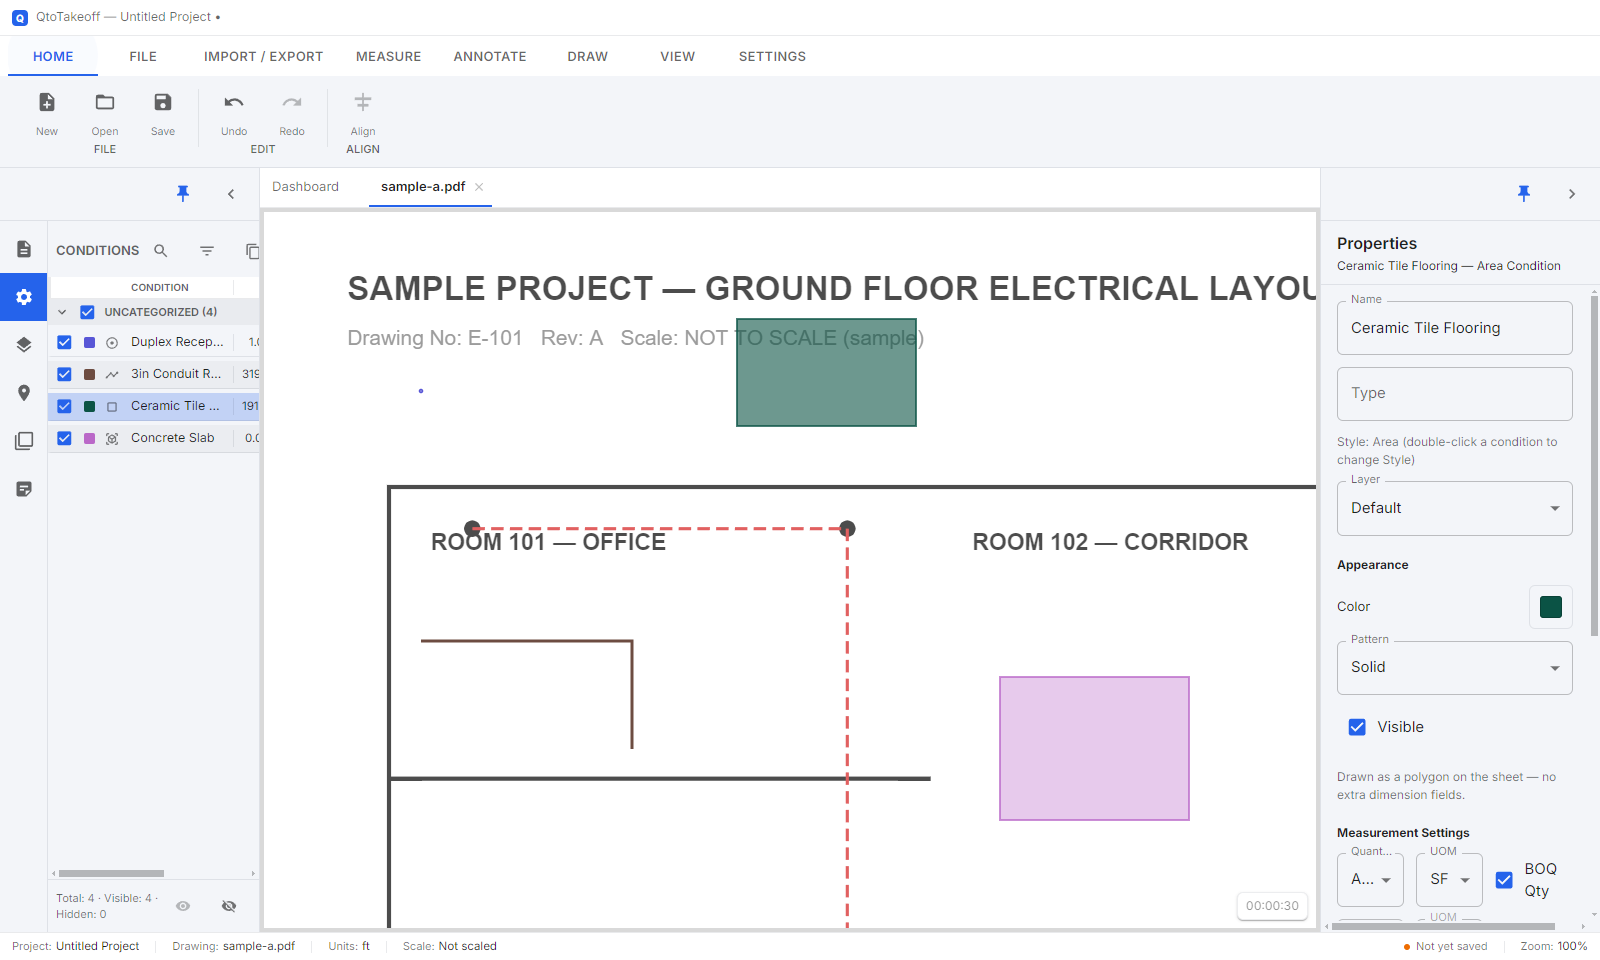
- Define what you're measuring as Conditions (e.g. "Duplex Receptacle", "3″ Conduit", "Ceramic Tile Flooring") — each with a Style (Count / Linear / Area / Volume), a color, and one or more quantities to calculate.
- Click/drag on the drawing to place measurements — QtoTakeoff totals them live.
- Mark up the drawing with text, clouds, dimensions, and stamps as needed.
- Get your numbers out: a Takeoff Summary, an Excel workbook, a full priced BOQ, or a marked-up PDF to hand off.
Everything described in this document — every dialog, field, and button — reflects the app exactly as of version 3.4.0. Where a fact from an earlier version has changed (e.g. autosave, which didn't exist in earlier builds), this document states the current behavior.
1Installing & Activating
Installation
QtoTakeoff is distributed as a single Windows installer, QtoTakeoff Setup <version>.exe. Run it and follow the standard Windows installer prompts:
- The installer shows a License Agreement page (the End-User License Agreement, Disclaimer, and Privacy Policy combined — see Legal) — you must accept it to continue.
- Choose an install location (or accept the default) — the installer lets you change the installation directory.
- Choose whether to create a Desktop shortcut and Start Menu shortcut (both are offered by default).
- Finish — QtoTakeoff launches.
The installer window title and the installed program both show the exact version number (e.g. "QtoTakeoff Setup 3.4.0") — useful for confirming you have the build you expect, especially if support asks which version you're running.
Activation (first launch)
QtoTakeoff uses an offline, machine-locked license — no internet connection is used or required to activate it. On first launch, you'll see the Activate QtoTakeoff screen, which opens with a short "How licensing works" summary of the steps below.
| What you see | What to do |
|---|---|
| "Your Details" | Fill in your Name, Company, Email, Mobile, Country, and Address. |
| "Export Request File..." | Click this to save a .qtoreq request file. It automatically bundles your details together with this computer's machine fingerprint — there's nothing to copy or read out by hand. Send that one file to your vendor (email, etc.). |
| "Already have a license file? Import it" | A small link near the bottom of the screen. Once your vendor reviews your request and sends back a license file (a .qtolic file), click this, pick the file — the app unlocks immediately, no restart needed. |
If a license ever stops validating later (e.g. it expired, or the file is corrupted), the app shows the same screen again, retitled "License Problem", with a plain-language reason (expired, wrong computer, damaged file, etc.) and the same Import link to fix it.
Your computer's machine fingerprint is tied to several hashed hardware identifiers, but tolerates minor hardware changes — e.g. replacing a failed hard drive alone won't invalidate an existing license, since only 3 of 4 identifying components need to still match. Both the request file and the license file are encrypted, so neither can be read by opening it in a text editor.
License Information (after activation)
Once activated, Toolbar → File tab → License opens the License Information dialog any time, showing:
- A status chip — "Active — Lifetime", or "Active — N day(s) remaining" for a time-limited license.
- Customer — Name, Company, Email, Phone, Address.
- License — License Number, License Type, Product name/version, Purchase Date, Activation Date, Expiry Date (or "Never (Lifetime)").
- Machine — this computer's short activation code.
- Replace License... — import a renewed/upgraded license file, effective immediately.
- Remove License — deactivates the license on this computer (asks for confirmation first).
License types: Lifetime (never expires), Annual, Monthly, Trial, or a Custom duration — your vendor determines which one your license file grants.
2The Interface at a Glance
Here's the full top toolbar (ribbon), labeled. Refer back to this any time you're not sure where something lives.
The rest of the window is laid out as:
- Left panel — tabs for Conditions, Zones, Layers, Sheets, and (when open) BOQ-related lists. Collapsible via the pin/chevron at its top.
- Center — the drawing canvas, with a tab strip above it (Dashboard, each open Sheet, BOQ Report, Drawing Compare when active).
- Right panel — Properties for whatever's currently selected (a condition, an annotation, or a "set style before placing" form for an armed tool).
- Status bar (bottom) — project name, active drawing, units, current scale, save status, and zoom %.
3Starting a Project
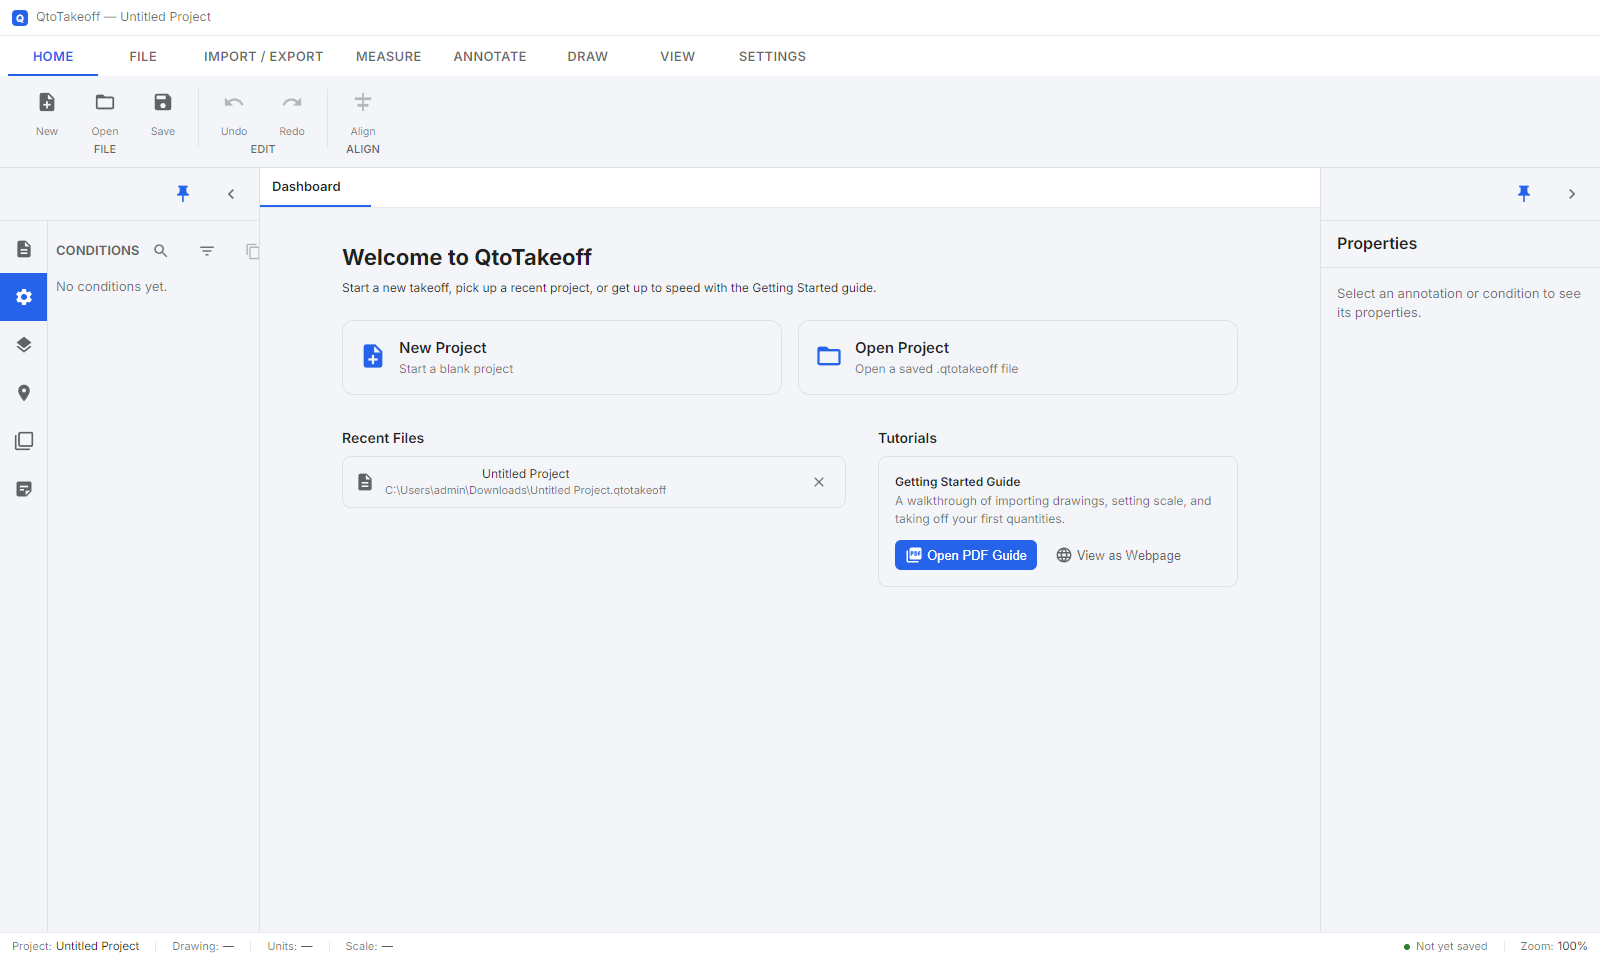
- Open QtoTakeoff.
- Toolbar → New Project (top-left icon), or start from the Dashboard.
- You land on an empty canvas with the Conditions/Zones/Layers/Sheets panel on the left.
4Importing a Drawing
QtoTakeoff works directly on top of a PDF drawing — no CAD file, no conversion step.
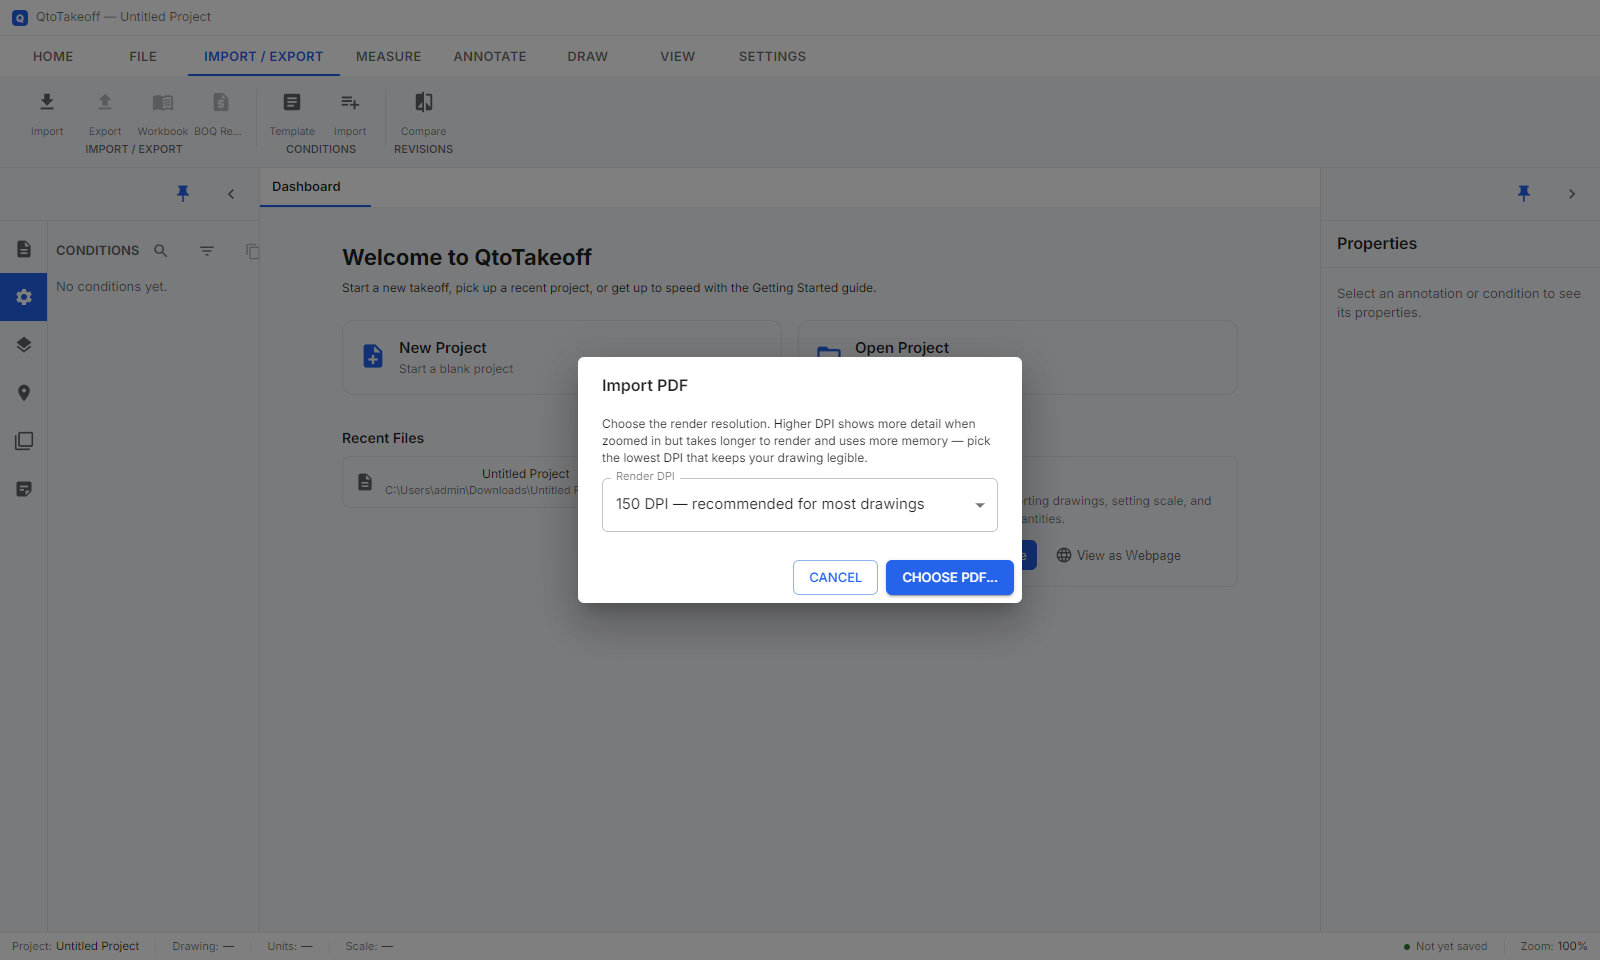
- Toolbar → Import/Export tab → Import.
- Pick your PDF file.
- Choose an import DPI (100–400) — higher looks sharper but takes longer and uses more memory. 150–200 is a good default for most drawings; go higher only for very detailed sheets.
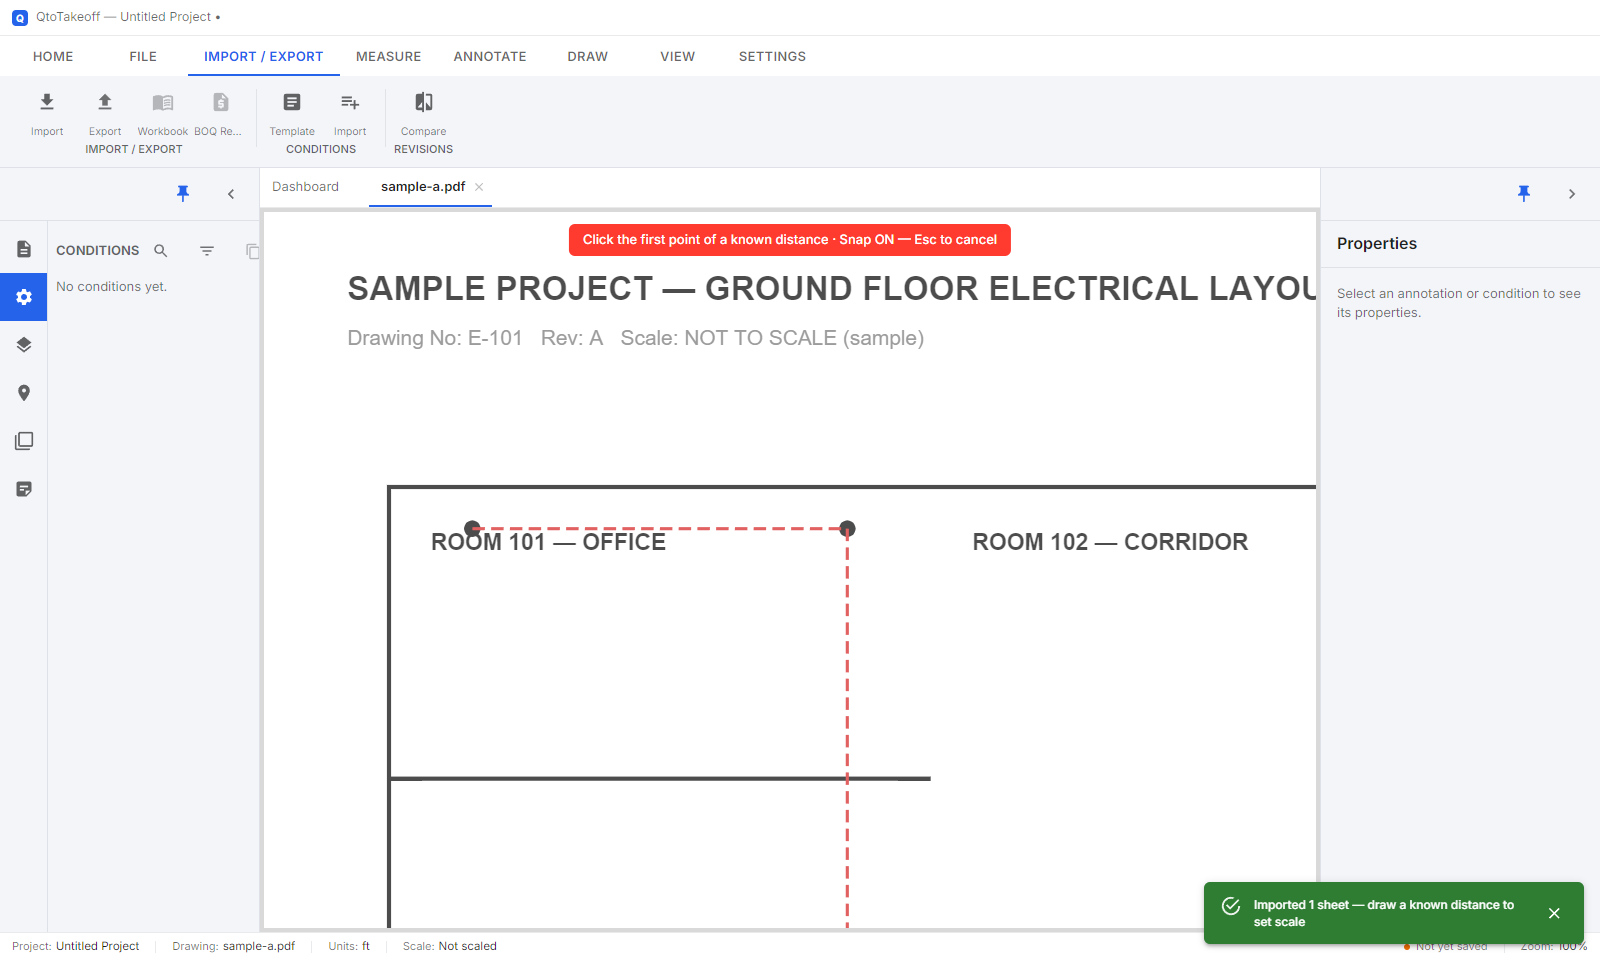
Multi-page PDFs import as one Sheet per page — see Sheets & Multiple Pages.
Very large sheets at very high DPI: browsers (and this app) can't create an unlimited-size image canvas. An extremely large sheet (e.g. a 34″×44″ drawing) at a very high DPI can hit that ceiling — QtoTakeoff automatically renders it at the highest DPI that still fits safely and tells you with an on-screen notice, rather than silently producing a blank sheet. If you see this notice often, try importing at a lower DPI.
5Setting the Scale
Before any measurement means anything, tell QtoTakeoff how big the drawing really is. This is per-sheet — every sheet (and every Additional View) needs its own scale set once.
- Toolbar → Measure tab → Set Scale.
- Click two points on the drawing where you know the real-world distance (e.g. both ends of a dimension already printed on the drawing).
- Type in that real-world distance and its unit, confirm.
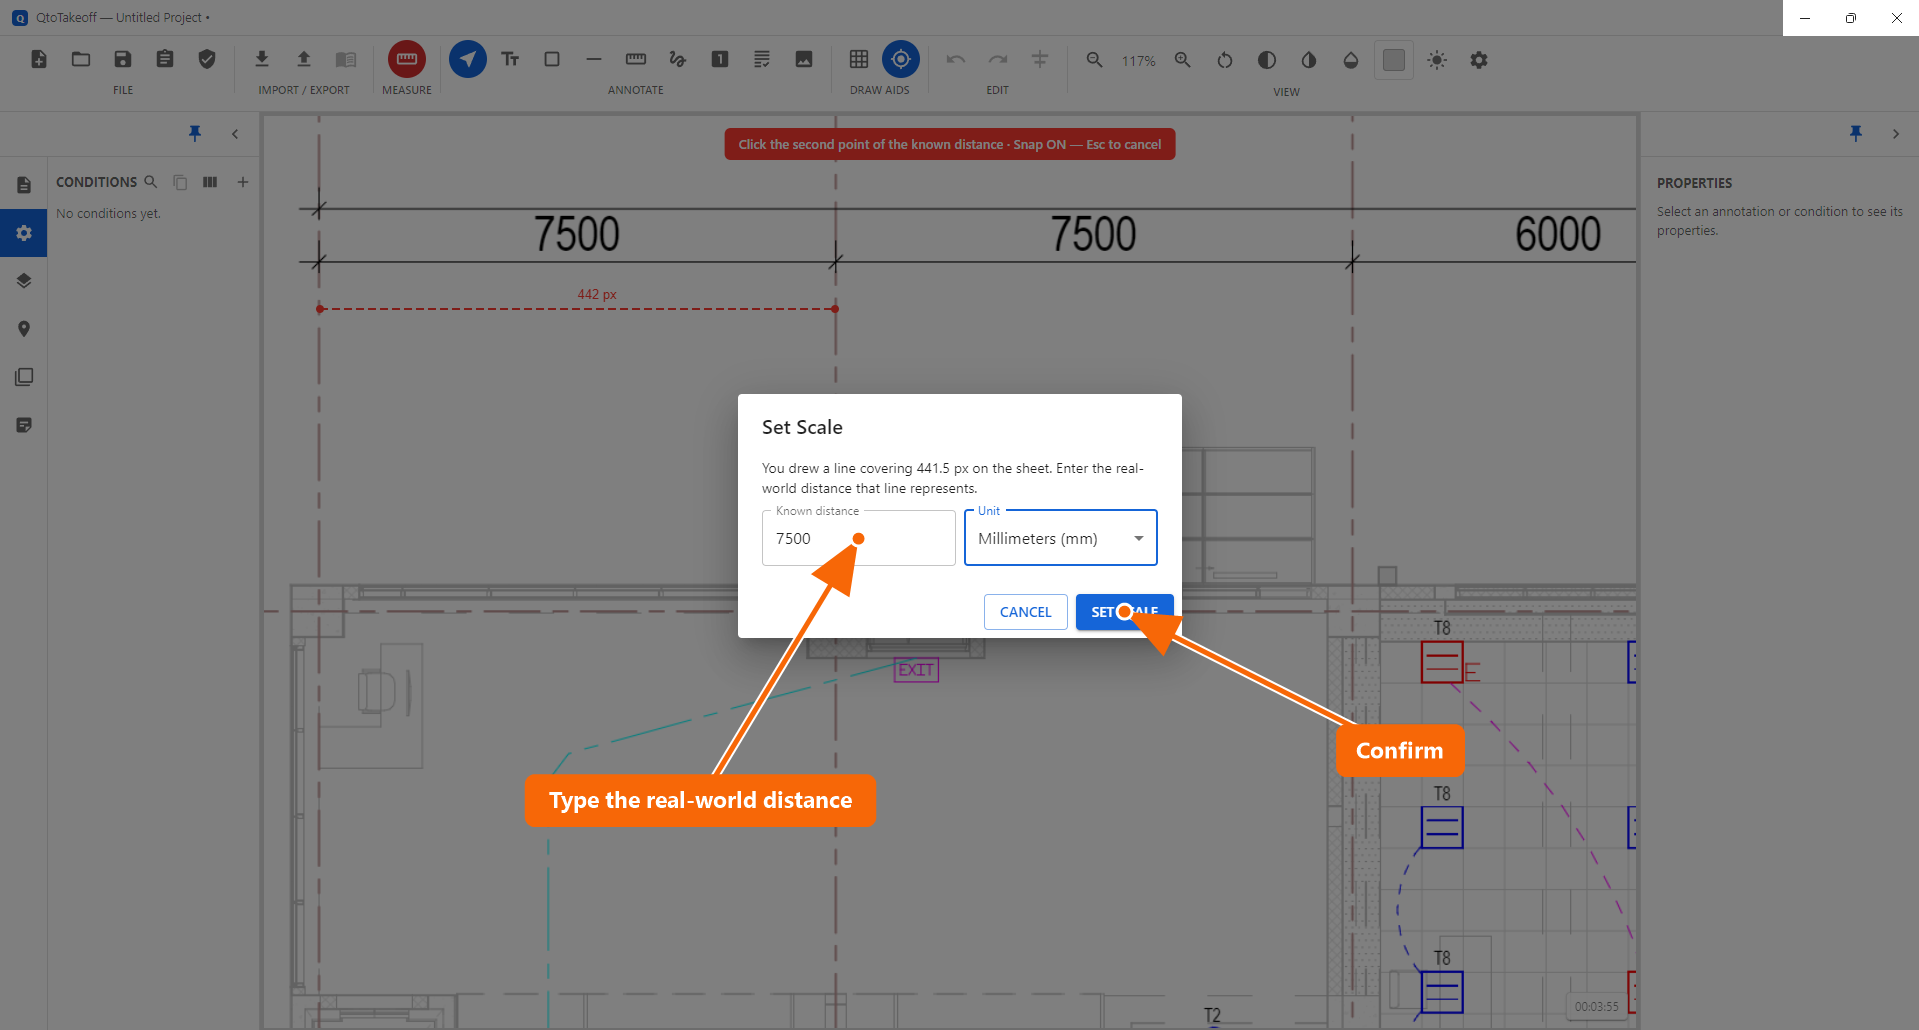
Every measurement you take afterward — length, area, volume — is calculated from this calibration. If it's off, everything downstream is off by the same factor. Hold Shift while picking your two points to snap to perfectly horizontal/vertical (Ortho).
6Sheets & Multiple Pages
Every page of an imported PDF becomes its own Sheet. Switch between them from the Sheets tab on the left panel.
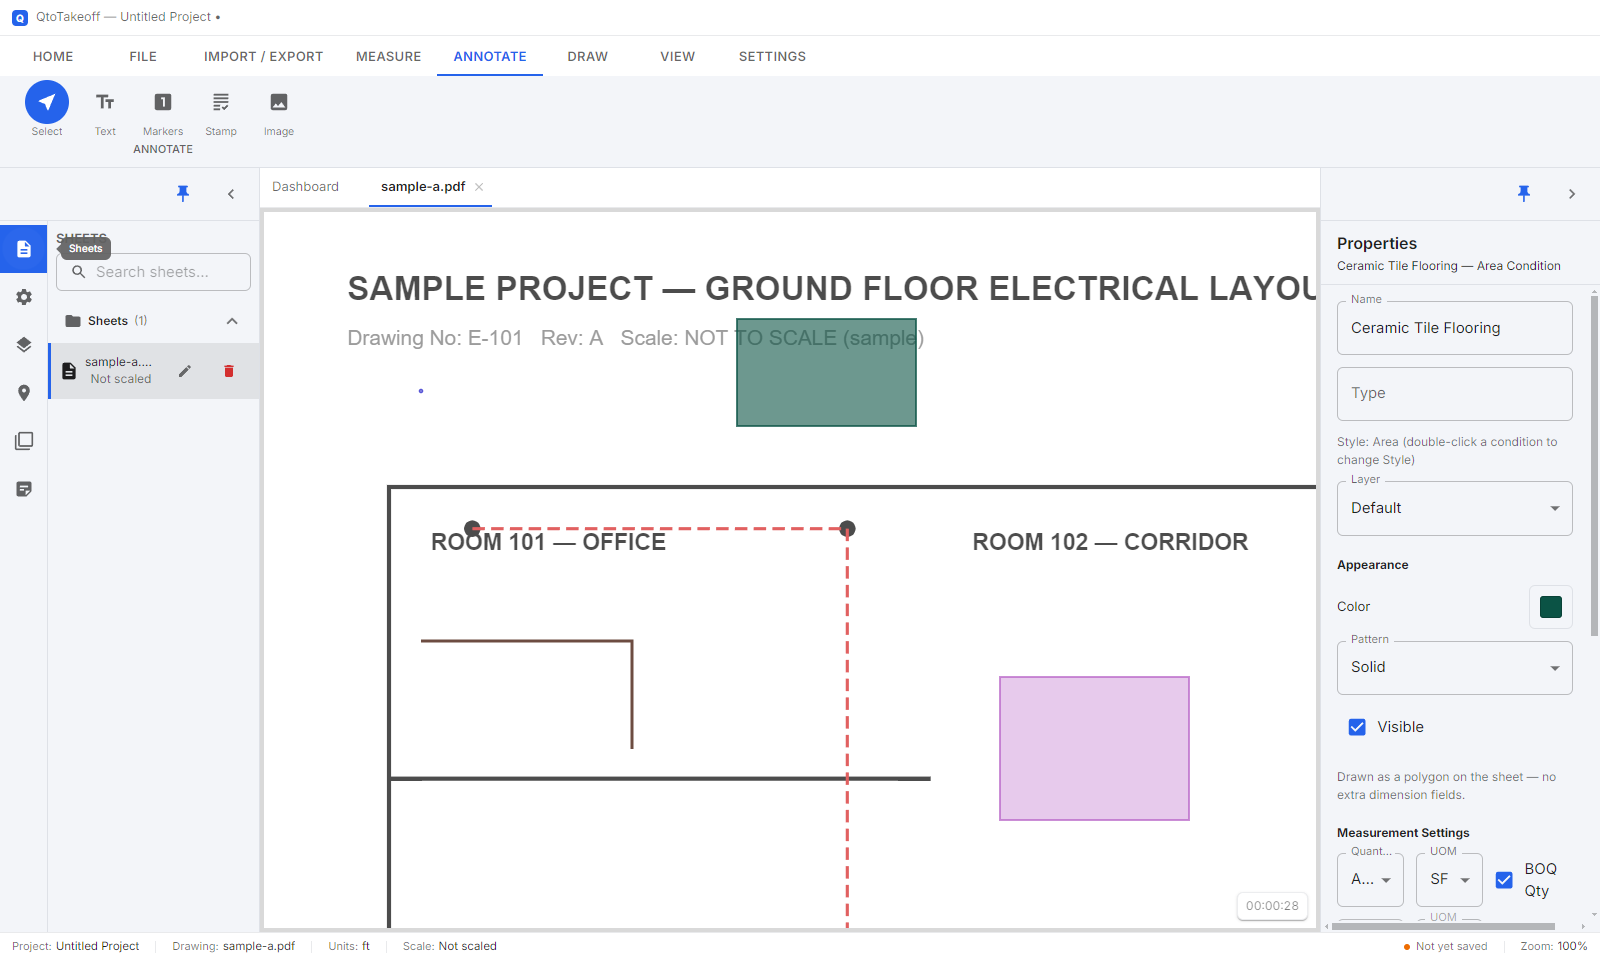
Sheets are grouped into collapsible folders by their Drawing Name (a field you set per sheet — e.g. "Architectural", "Electrical" — sheets with no Drawing Name land in a catch-all "Sheets" folder). Each row shows the sheet's revision (if set) or its current scale, and hovering reveals a pencil (Sheet Properties) and trash (Delete) icon; right-click for the same options in a menu.
Sheet Properties
The pencil icon (or right-click → Sheet Properties…) opens a dialog with two tabs:
| General tab | Sheet Name, Drawing Name (the field sheets are grouped by), Revision No., Revision Date. |
|---|---|
| Drawing Source tab | File location — shows the linked PDF path and a Found/Missing/Checking status. Show in Folder opens it in Explorer; Relocate File... re-links it if the PDF file was moved. |
| Render resolution — shows the current DPI and pixel size; pick a new DPI and click Apply to re-render at that resolution. Every existing takeoff item and dimension is automatically rescaled to match, so nothing shifts out of place. | |
| Compare & Replace Drawing... — for a revised or wrongly-imported drawing. Opens the Drawing Compare tool with this sheet pre-loaded, so you review exactly what changed before anything is actually replaced. |
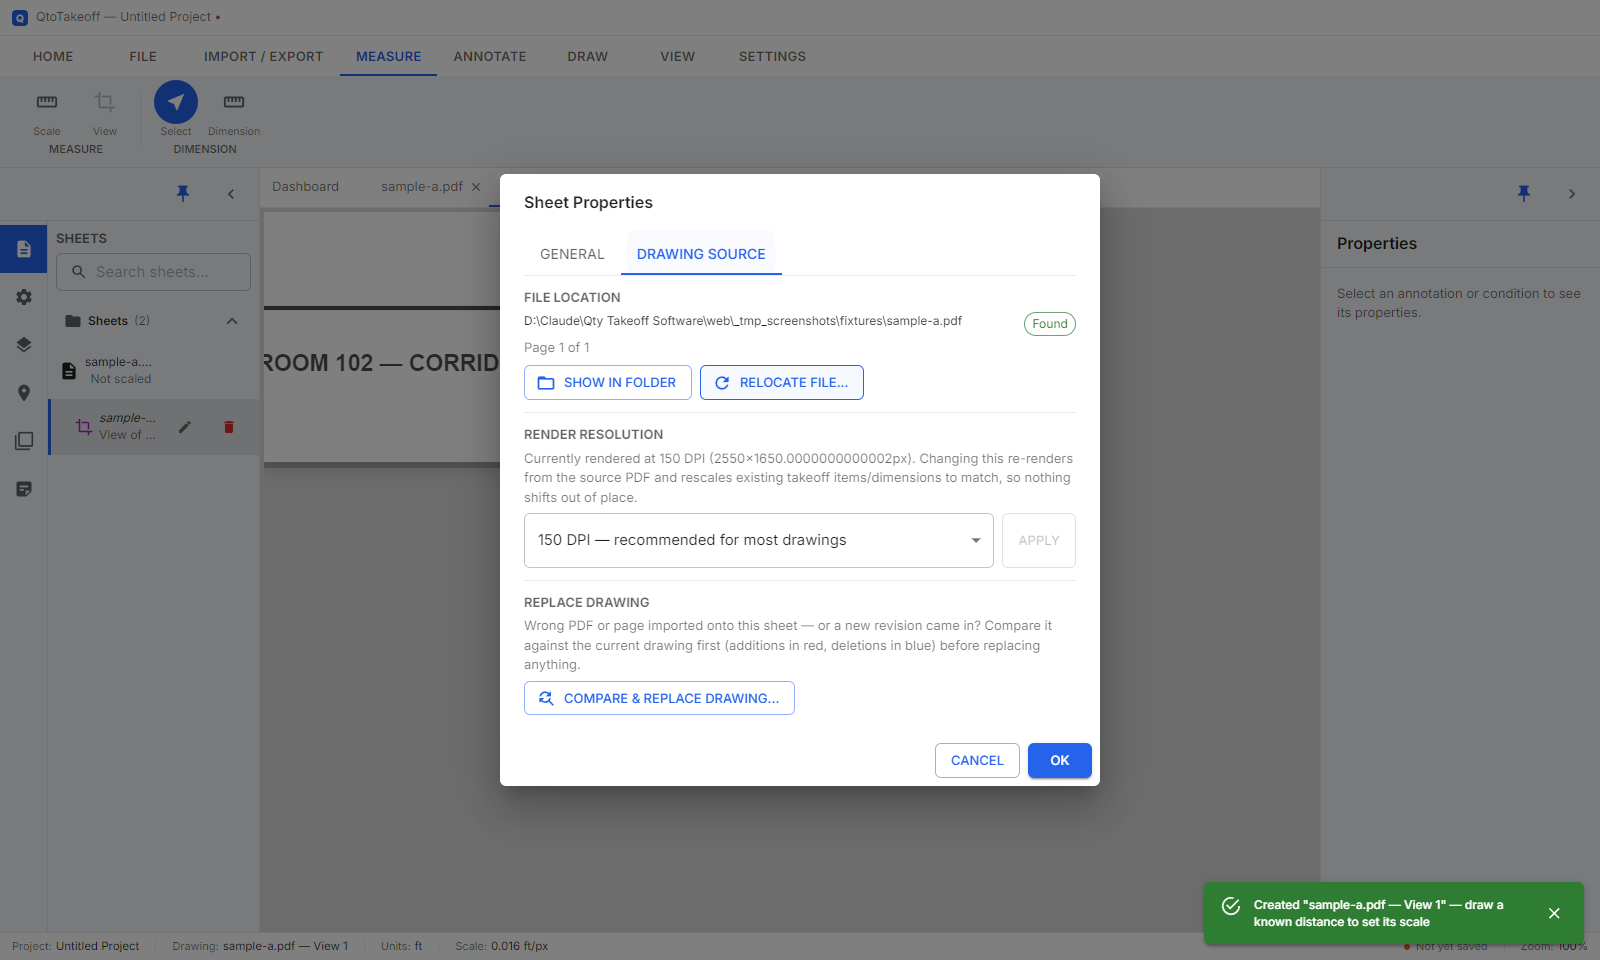
Deleting a sheet permanently removes every takeoff item, dimension, and note on it — and cannot be undone. If the sheet has any Additional Views cropped from it, the confirmation dialog warns you those are deleted too (a view has no meaning without its parent sheet).
7Additional ViewsMulti-scale sheets
Sometimes one page of a drawing set actually contains two separate drawings at two different scales — a main plan plus a detail callout, for example. An Additional View solves this: it's a cropped sub-region of a sheet that gets its own independent scale and its own independent takeoff, while still living under its parent sheet.
- Toolbar → Measure tab → Create View.
- Drag a rectangle around the second drawing/detail on the current sheet.
- A new sheet is created — a crop of exactly that region — and you're dropped straight into Set Scale for it, since a view has no principled relationship to its parent's scale.
Views are shown nested under their parent in the Sheets panel — indented, with a crop icon and an italicized name — and the parent sheet's canvas shows a dashed outline around the region each view came from, so it's obvious at a glance which part of the page has its own separate takeoff.
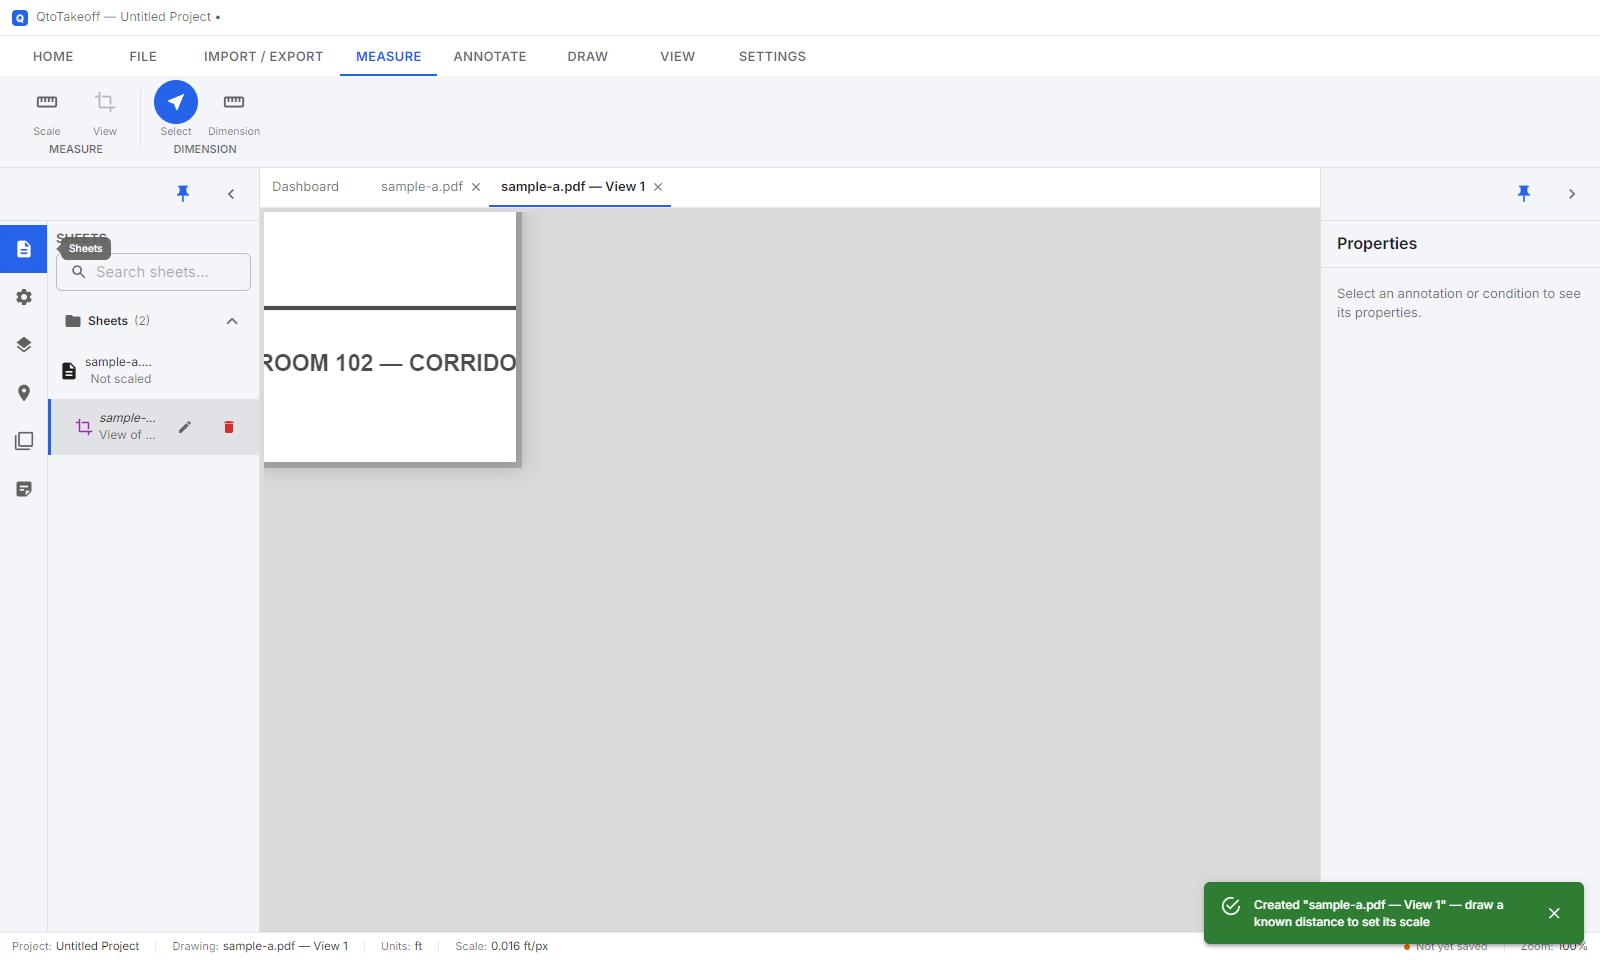
A view's resolution and drawing always follow its parent — Sheet Properties for a view shows both controls disabled, pointing you to the parent sheet instead. Re-rendering the parent (Change Resolution, or accepting a drawing revision) automatically re-crops and re-renders every one of its views too.
8Conditions — Overview
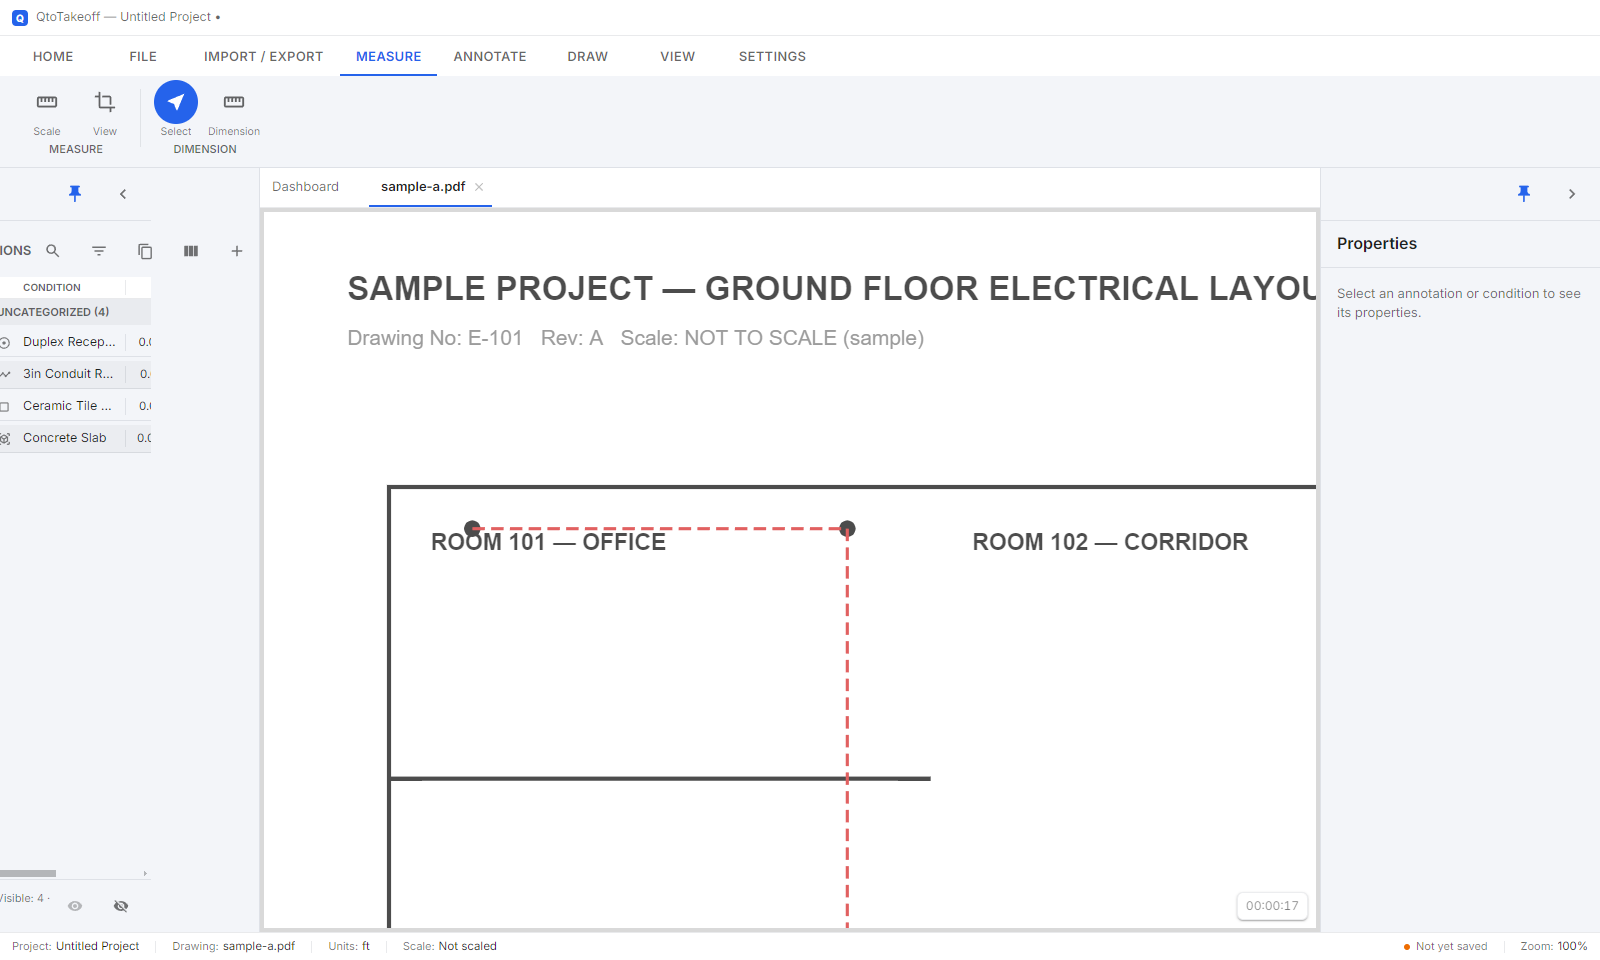
A Condition is a category of thing you're taking off — e.g. "Duplex Receptacle" or "3″ Conduit". Every measurement you draw belongs to a Condition, and QtoTakeoff totals them up automatically as you go.
- Conditions tab (left panel) → +.
- Pick a Style: Count (individual items), Linear (length/runs), Area, or Volume.
- Give it a name, color, and marker/line style, choose what quantities it should calculate, then Save.
9Condition Properties — Full Reference
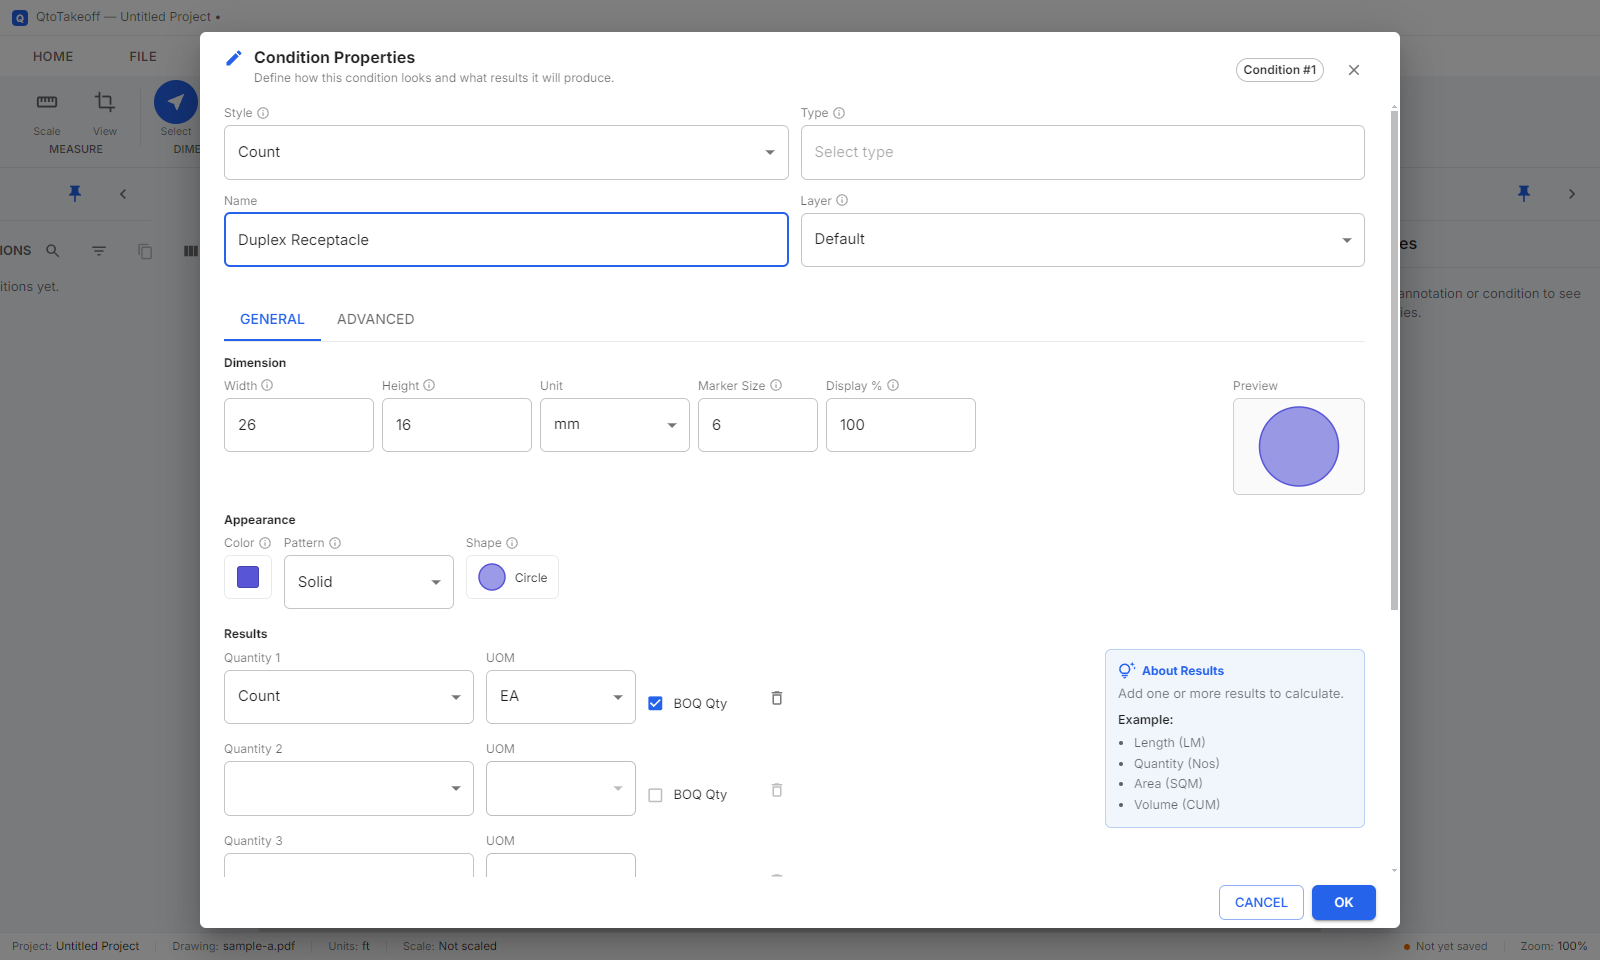
This is the most detailed dialog in the app — here's every field, tab by tab. It's the same dialog whether you're creating a new condition or double-clicking an existing one to edit it.
Always visible (above the tabs)
| Style | Count, Linear, Area, or Volume — the fundamental measurement type. Changes which other fields/tabs apply. |
|---|---|
| Type | A free-text category (e.g. "Framing", "Electrical") used to group conditions in the Conditions panel list. Two conditions can share a Name only if their Type differs. |
| Name | The condition's own name — must be unique within its Type. |
| Layer | Which Layer this condition's markup belongs to (or none) — see Layers. |
General tab — Dimension
| Count | Width, Height (the marker's real on-paper footprint — feeds Perimeter/Surface-area/Volume results), Unit, Marker Size (non-rectangle shapes), Display % (10–1000, scales the on-screen symbol without changing its real measured size). |
| Linear | Thickness (relabels to Diameter for round duct), Height (hidden for round duct), Unit, a "Round duct (Thickness = diameter)" checkbox, and Bend Radius (× Thickness/Diameter — rounds drawn corners and feeds the Bend Radius result). |
| Area / Volume | No extra dimension fields — drawn as a plain polygon on the sheet. |
A live preview shows the condition's actual on-screen appearance as you edit any of these.
General tab — Appearance
| Color | The condition's body/fill (and Linear band) color. |
|---|---|
| Pattern | Count: Solid or Transparent (outline only). Linear/Area/Volume: also Diagonal, Cross, Horizontal, Vertical, or Grid hatch, or Dots. |
| Shape (Count only) | Opens the searchable Marker Shape Picker — every built-in industry symbol plus your own custom symbols, grouped by category. |
| Line Type (Linear only) | None (not drawn — still tracks quantities), Continuous, Dashed, Center, Phantom, Hidden. If not None: Line Weight (0.25–6mm real pen weight), Line Color (can differ from body Color), and Line Type Scale (dash size, if not Continuous). |
General tab — Results (up to 3 quantity slots)
Each of the three Quantity slots independently picks a result type to calculate and total, plus its own unit of measure:
| Count | Count, Total Height, Perimeter, Surface Area (top/bottom, or all sides, or all sides + top & bottom), Volume |
| Linear | Length, Segment Count, Surface Area (single/both side, top/bottom, single/both end, all sides/duct), Volume, Bend Radius (the 4 flat-side surface-area options drop out for round duct) |
| Area | Area, Perimeter, Volume |
| Volume | Volume, Footprint Area, Perimeter |
Only one slot at a time can be checked as "BOQ Qty" — that's the value the BOQ Report uses as this condition's quantity column (if none is checked, the BOQ falls back to a flat quantity of 1, i.e. lump sum).
General tab — BOQ & Notes
| Section Name | Cross-reference heading text for an externally-produced BOQ (descriptive only, never calculated). |
|---|---|
| BOQ Item No | Cross-reference line-item number. |
| BOQ Description | Cross-reference description text (multiline). |
| Notes | Free-text notes, multiline. |
Supply/Installation Rate is deliberately not set here — you enter it directly, inline, in the BOQ Report itself.
Advanced tab
| Depth + Unit | Extrusion depth used for Volume/surface-area calculations. Shown whenever it's actually needed for the current Style + chosen quantities (always for Volume; conditionally for Area/Count when a Volume-related quantity is selected). |
|---|---|
| Fill transparency | 10%–100% opaque. |
10The Conditions Panel
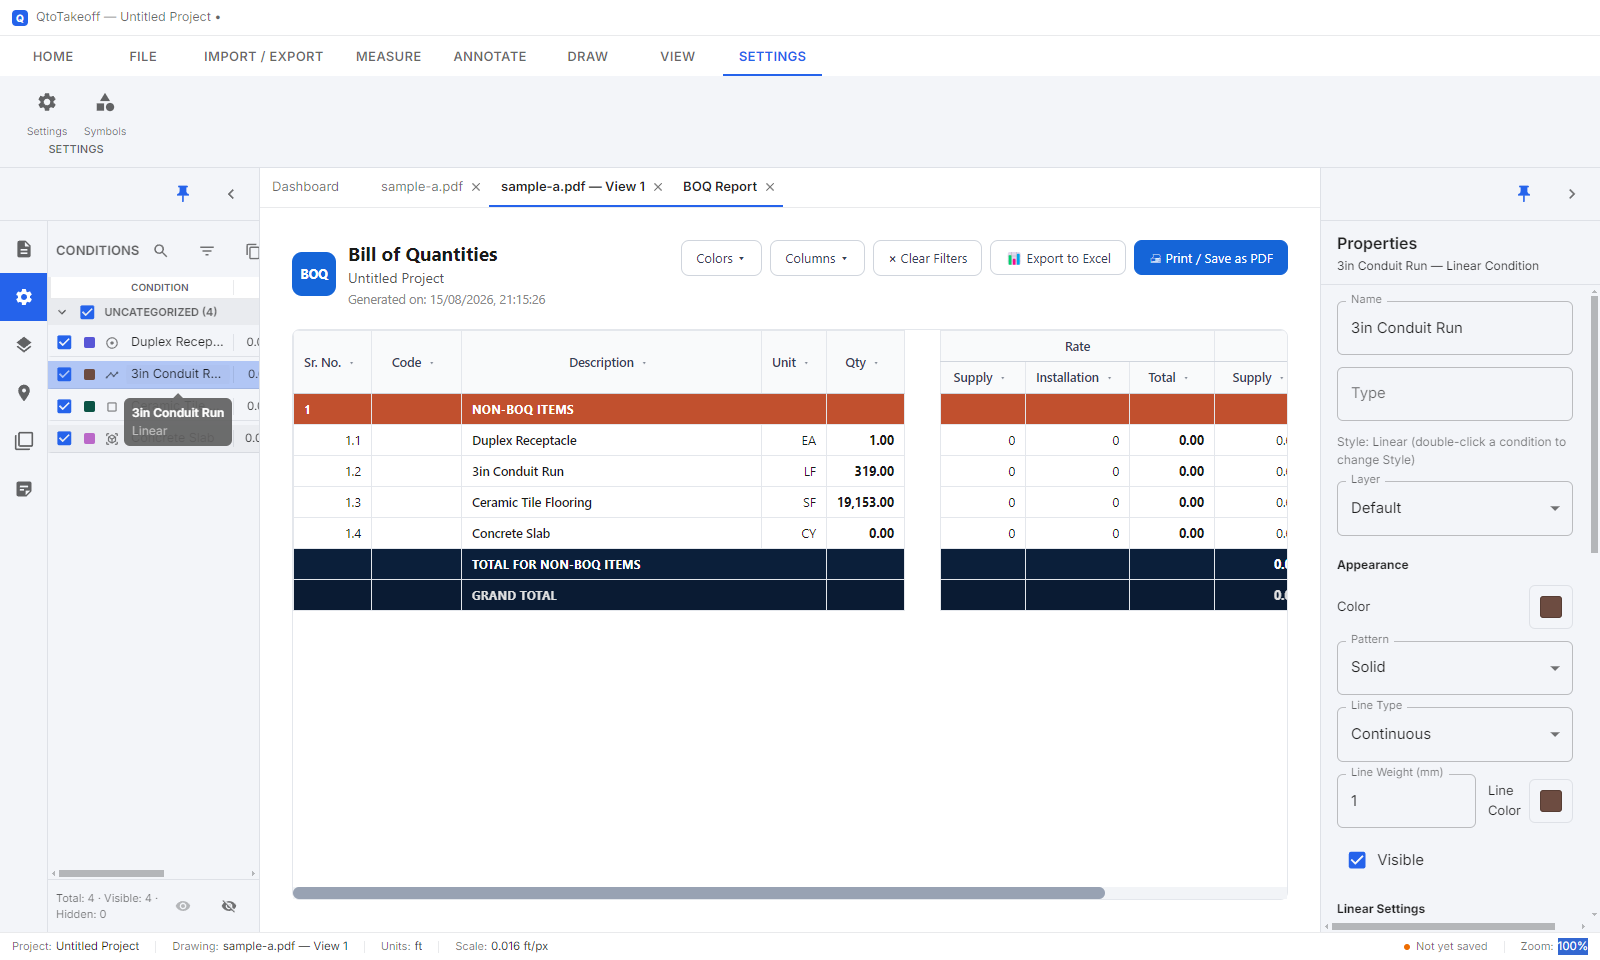
The left panel's Conditions tab is your working list while taking off — click a condition to arm it (highlighted), then measure on the drawing. Its Qty1/Qty2/Qty3 columns update live and are scoped to whichever sheet is currently active — switch sheets and the numbers update to that sheet's own totals. Columns are sortable, resizable, and filterable; right-click a header for a Columns menu to show/hide any of them.
Selecting a condition also fills the right-side Properties panel with the same fields the full dialog has — a quick way to tweak color, pattern, or line settings without opening it.
For combined, all-sheets totals, see Takeoff Summary & Workbook.
11Count / Linear / Area / Volume Takeoff
Count
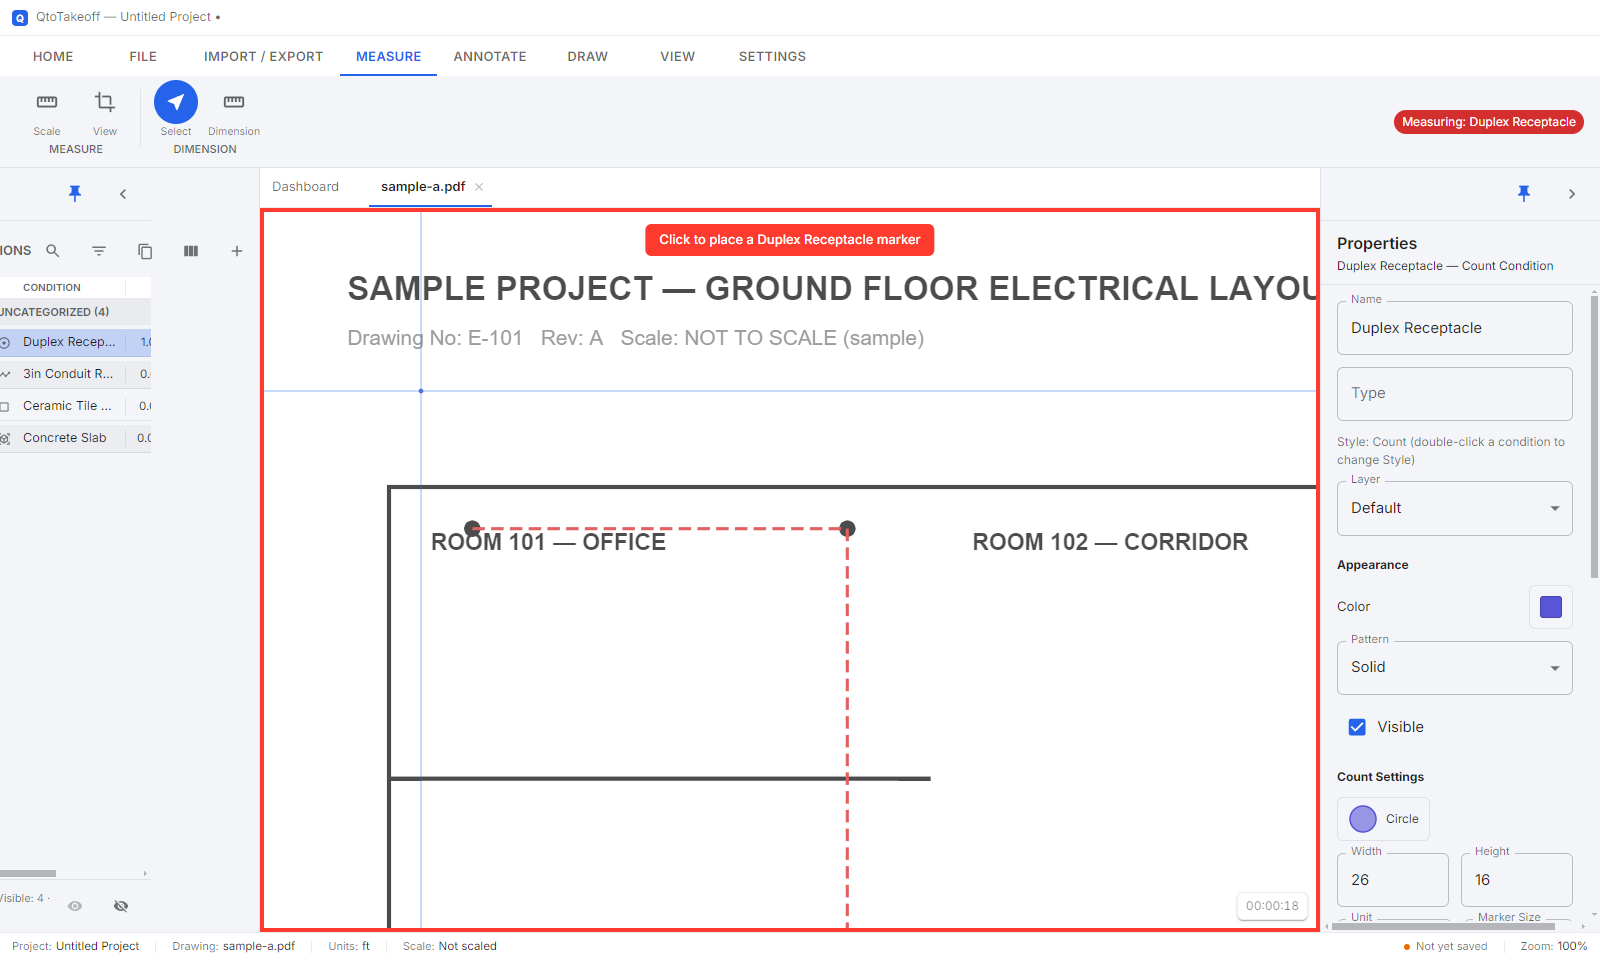
- Click a Count condition to arm it.
- Click once on the drawing for each item — a marker drops at that spot.
Linear
- Arm a Linear condition.
- Click a start point, then click along the run — each click adds a segment/bend.
- Press Enter to finish (or double-click the last point).
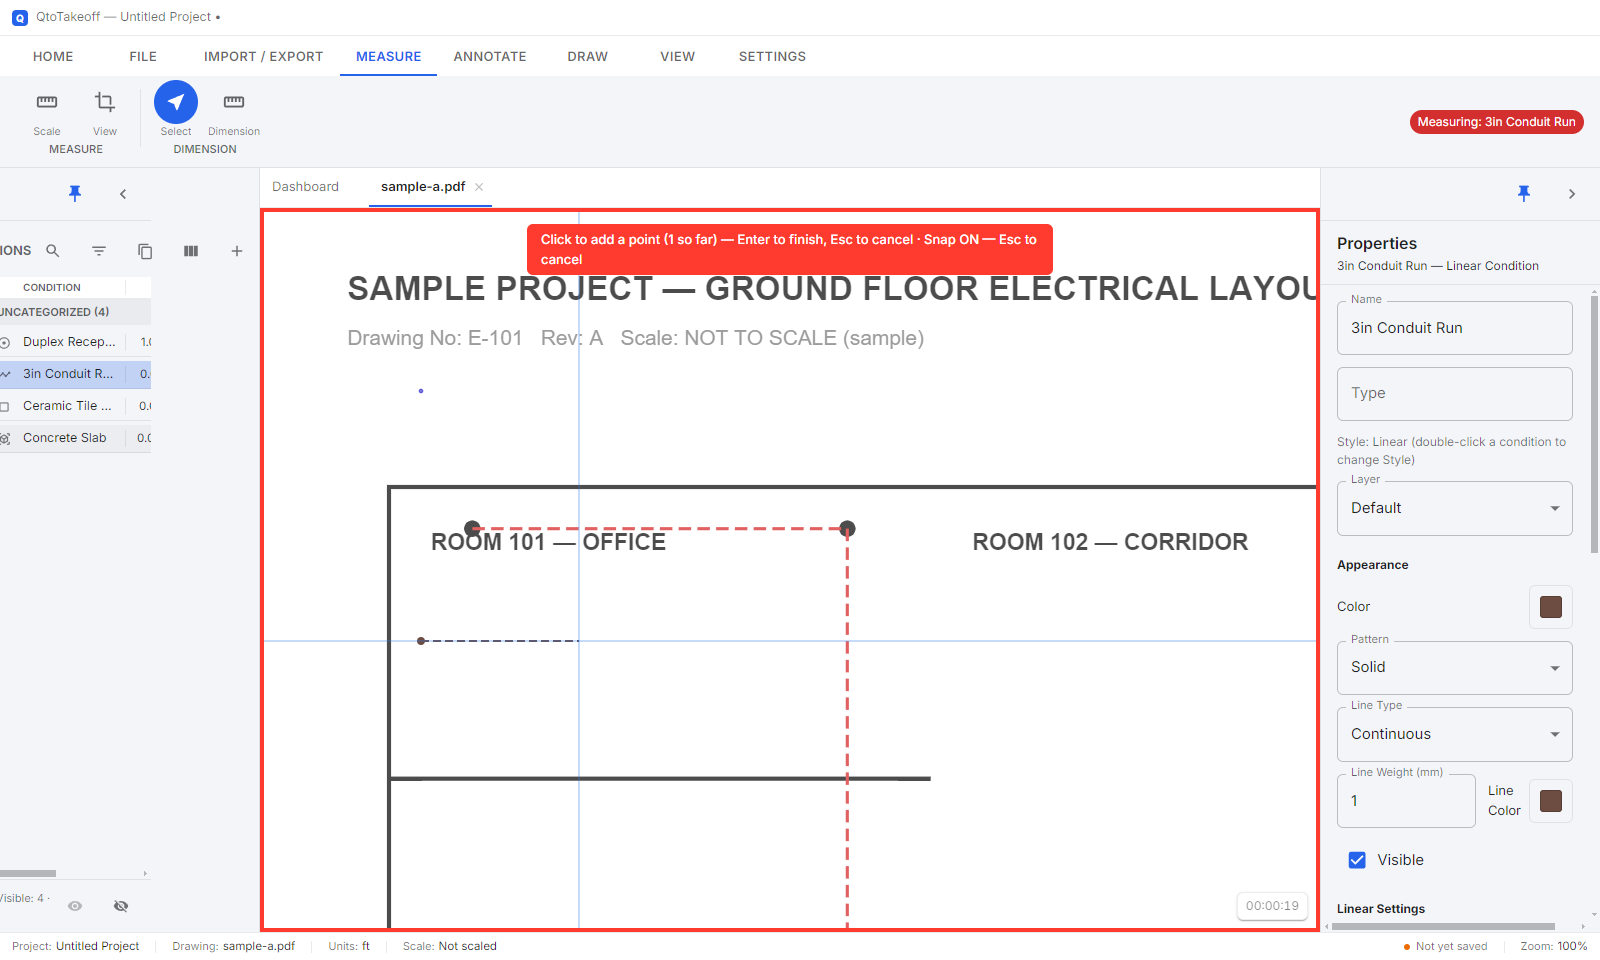
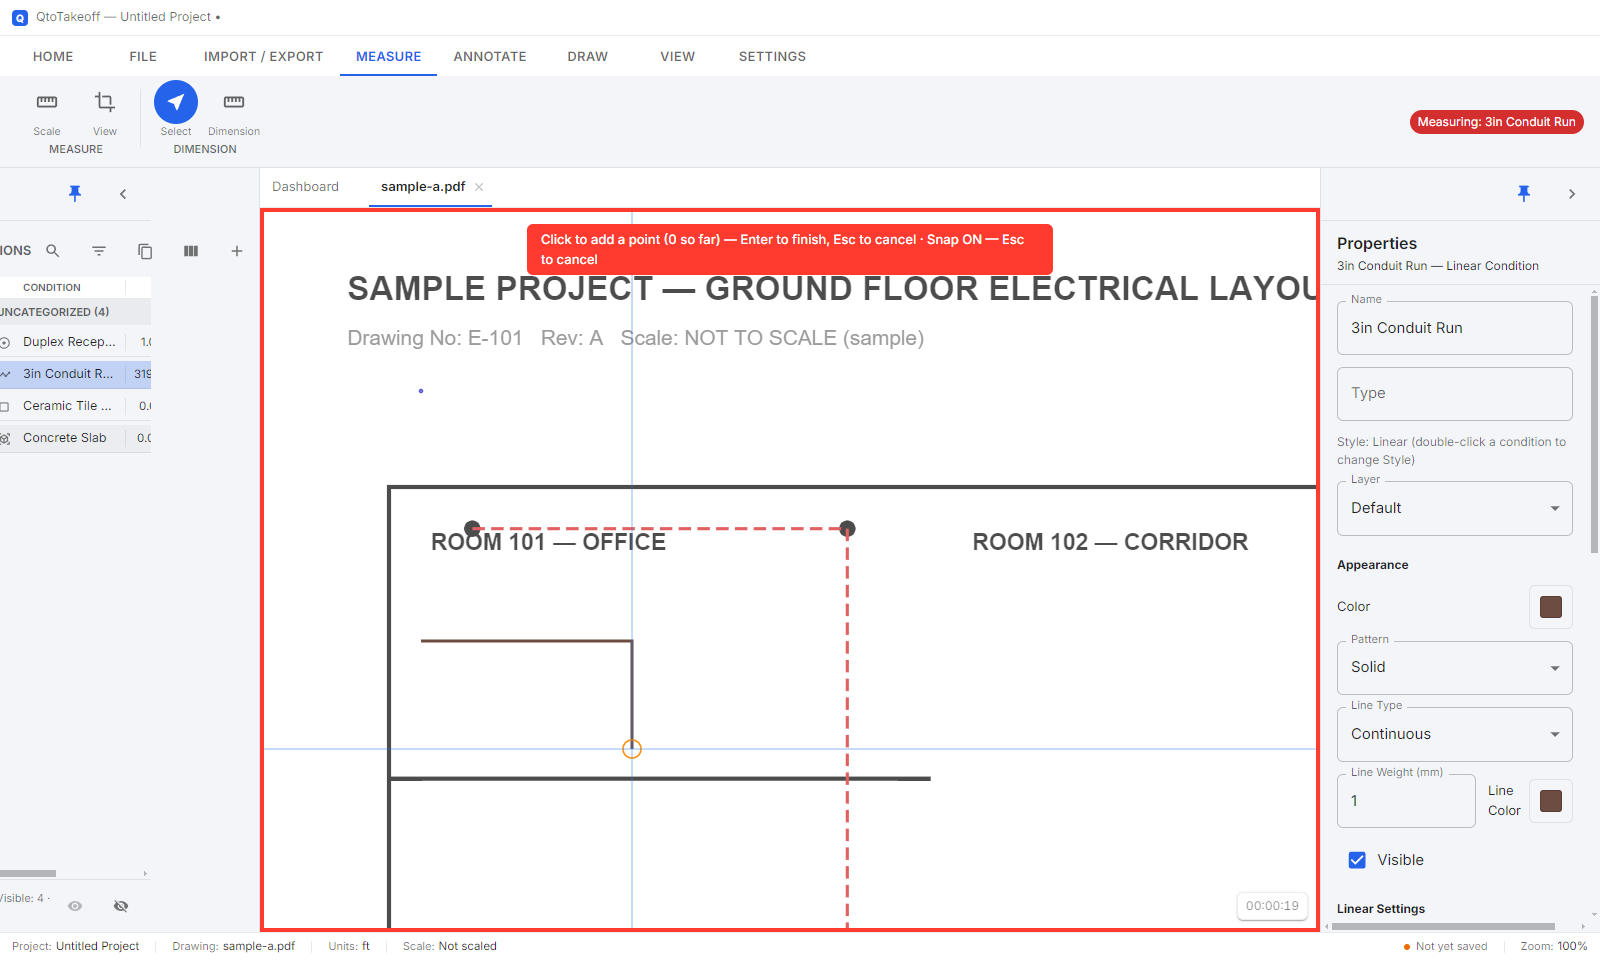
Hold Shift while drawing to snap to horizontal/vertical/45° (Ortho). Drag a vertex with Alt held to pull out a curve handle for a rounded bend.
Area & Volume
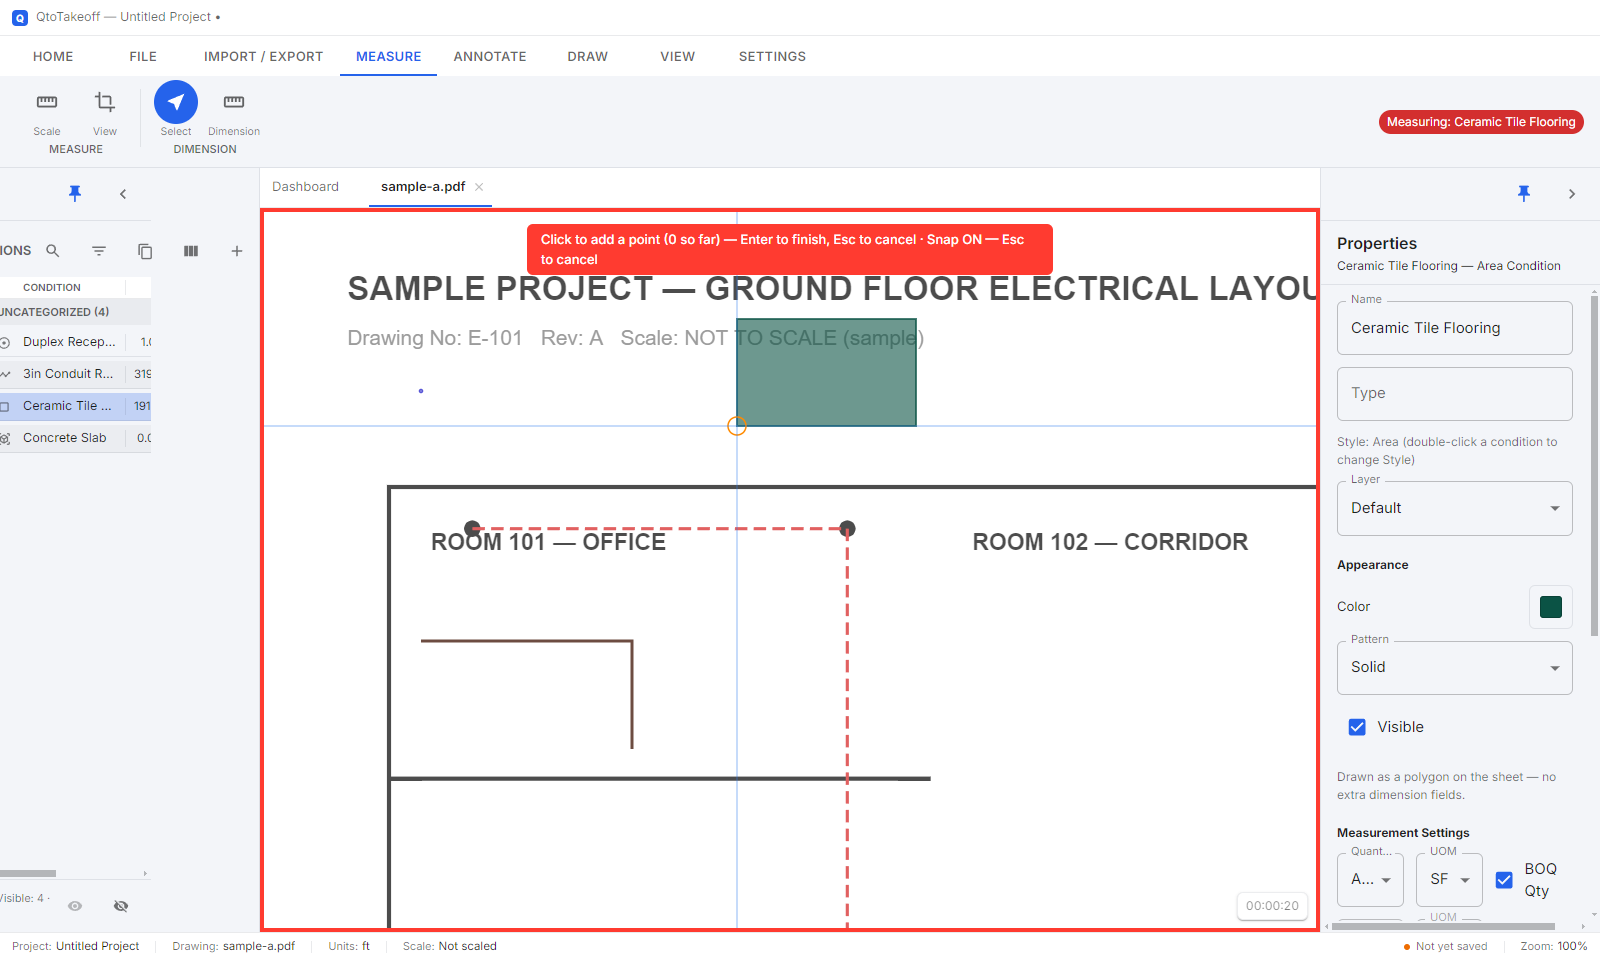
- Arm an Area or Volume condition.
- Click around the perimeter of the space (3+ points).
- Press Enter to close the shape.
12Select, Move & Undo
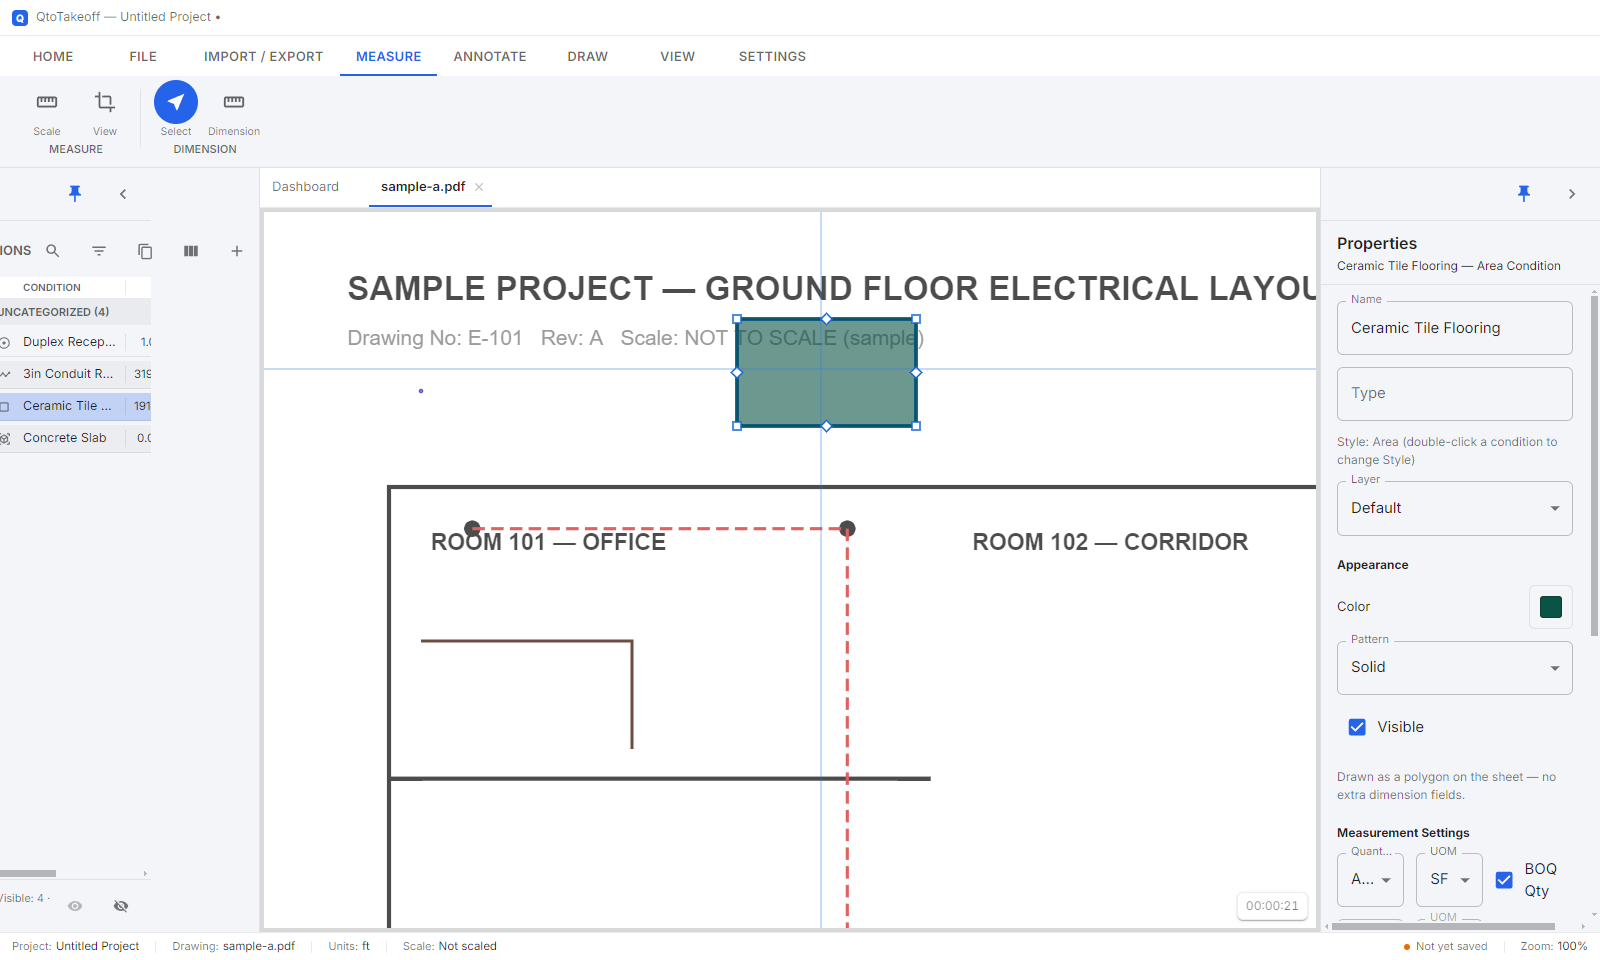
- Click any drawn item to select it (drag a box around several to multi-select, Ctrl+A selects everything on the sheet).
- Drag it to reposition; drag a corner/vertex handle to reshape it.
- Ctrl+Z undoes, Ctrl+Shift+Z (or Ctrl+Y) redoes.
- Select something and press Delete to remove it.
What undo does not cover: editing a Condition's own settings (rename, recolor, any Condition Properties field), editing a Layer's name, or a Zone's name/color/opacity/visibility — none of those are undo-tracked. Also, deleting a sheet, deleting a condition, starting a new project, or opening a project file each clear the entire undo history (not just skip one step) — there's nothing left to undo afterward. Undo/redo itself keeps the last 100 actions.
13Zones
A Zone is a freeform colored area you draw to spatially group parts of a drawing — e.g. "Phase 1" vs "Phase 2", or "Level 2 / Wing A" — independent of any Condition. Its only job is to let you break down quantities by area afterward.
- Zones tab (left panel) → +.
- Click points around an area, press Enter to close it (minimum 3 points).
- Toggle a zone's visibility from its checkbox in the panel; double-click its name to rename; click its color swatch for a color + opacity picker.
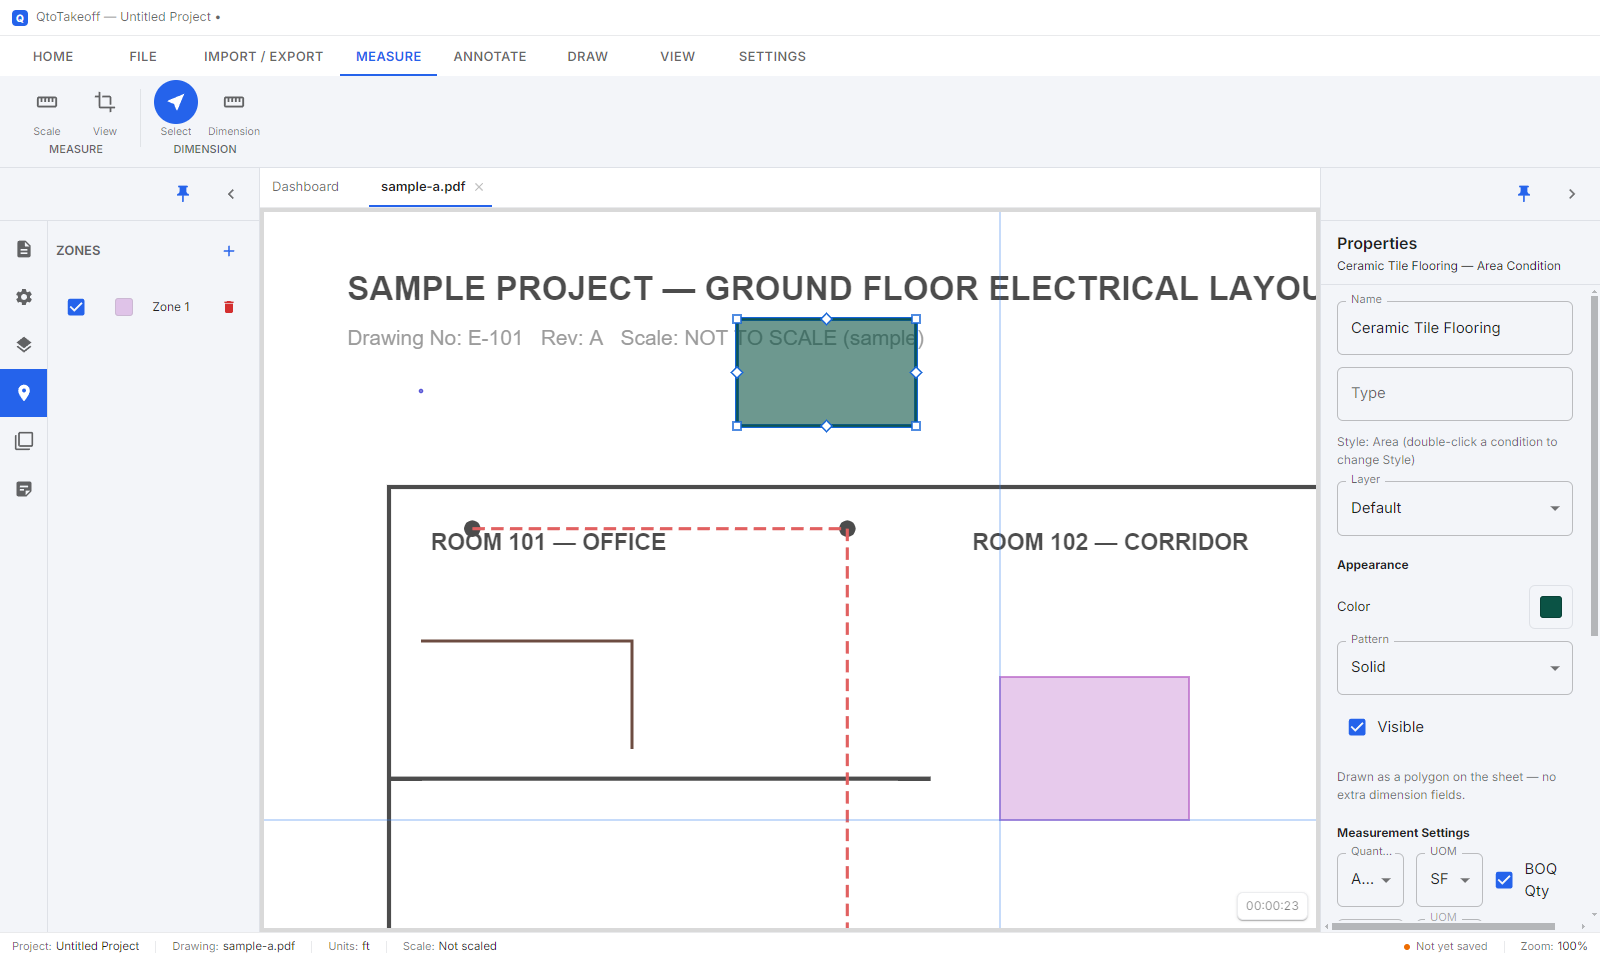
Zones on the same sheet can never overlap — QtoTakeoff blocks a draw/move/reshape that would create an overlap, so which zone a point belongs to is never ambiguous. A Linear run that physically crosses a zone boundary has its quantity split proportionally between the zones it passes through.
Zone-wise breakdowns appear in the Takeoff Workbook's Zone grouping and in the Zone column of the CSV/Excel Takeoff Summary exports (a "No Zone" bucket catches anything outside every zone). The BOQ Report does not use Zones — it groups by Section Name and BOQ Item No instead.
14Layers
QtoTakeoff actually has two separate layer systems — easy to mix up, so here's the distinction plainly:
| Layers (Layers panel) | Organize Conditions. Assign a condition to a Layer from its own Properties (the "Layer" dropdown). Hiding a layer hides every takeoff item drawn under every condition on it, all at once. No color, no lock — just a name and a visibility checkbox. |
|---|---|
| Annotation Layers (right-panel, for markups) | A completely separate system for organizing Annotations (text, clouds, dimensions, images, etc.) — independent of a Condition's Layer. Each has a name, a color, and a visibility checkbox; reorder with the up/down arrows. |
| Type (a Condition field, not a layer at all) | The free-text category field in Condition Properties (e.g. "Framing") — purely organizes the Conditions panel's own list into groups. It has no show/hide behavior of its own. |
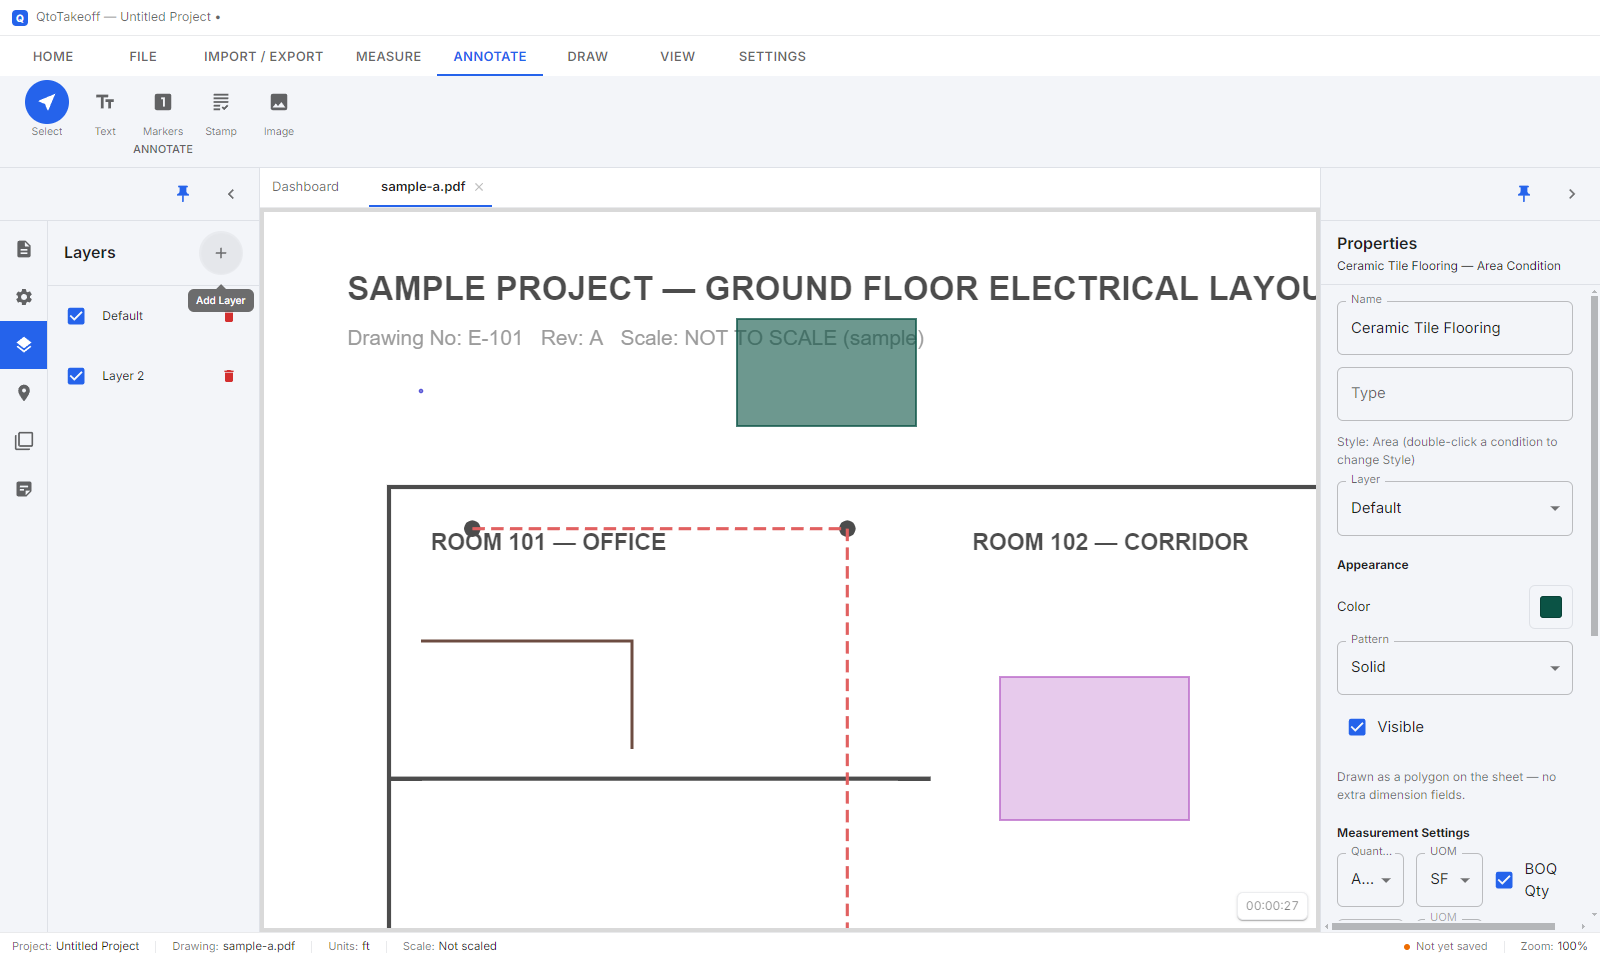
- Create a Layer: + icon at the top of the Layers panel.
- Rename: double-click its name.
- Delete: trash icon — conditions on a deleted layer simply fall back to "no layer," nothing is lost.
15Symbol Library
Count conditions can use an industry-standard pictograph instead of a plain shape — QtoTakeoff ships with a built-in catalog and lets you build and save your own.
Built-in catalog
| Generic | Circle, Square, Rectangle, Triangle, Diamond, Cross, Star |
|---|---|
| Electrical | Duplex Outlet, GFCI Outlet, Switch (1-way), Light Fixture (Ceiling), Panelboard, Junction Box, Disconnect Switch |
| Fire & Life Safety | Smoke Detector, Duct Smoke Detector, Fire Alarm Pull Station, Horn/Strobe, Sprinkler Head, Fire Extinguisher, Fire Alarm Control Panel |
| HVAC | Supply Diffuser, Return Air Grille, VAV Box, Thermostat, Exhaust Fan, Fire/Smoke Damper |
| ELV & Security | CCTV Camera, Speaker, Data/Voice Jack, Access Control Reader, Motion Sensor (PIR), Door Contact |
Pick any of these (or your own custom symbols — they appear in the same searchable picker) from a Count condition's Shape field — type to filter by name.
Building your own symbol
Toolbar → Settings tab → Symbols opens the Symbol Library dialog. Custom symbols you save here are available to every project on this computer, not just the current one.
- New Symbol to start fresh, or click an existing custom symbol thumbnail to re-edit it.
- Draw with the tool palette: Circle, Rectangle, Triangle, Polygon, Line, Arc, Freehand, or Text. Select/Move and Trim (cut away a piece where two shapes overlap) round out editing.
- With 2+ shapes selected, use Union, Combine, Fragment, Intersect, or Subtract to build compound shapes — plus Align, Rotate 90°, and Mirror for single or multi-selections.
- Name it (required) and optionally give it a Section to group it under, then Save.
Import/Export buttons in the left column let you share a whole custom symbol library as a JSON file with a colleague.
16Annotations & Markups
Beyond takeoff quantities, the Annotate ribbon tab lets you mark up the drawing itself — text notes, shapes, arrows, clouds, stamps, images, and more. Every annotation tool follows the same pattern: pick it, optionally set its style first in the Properties panel, then click/drag to place it.
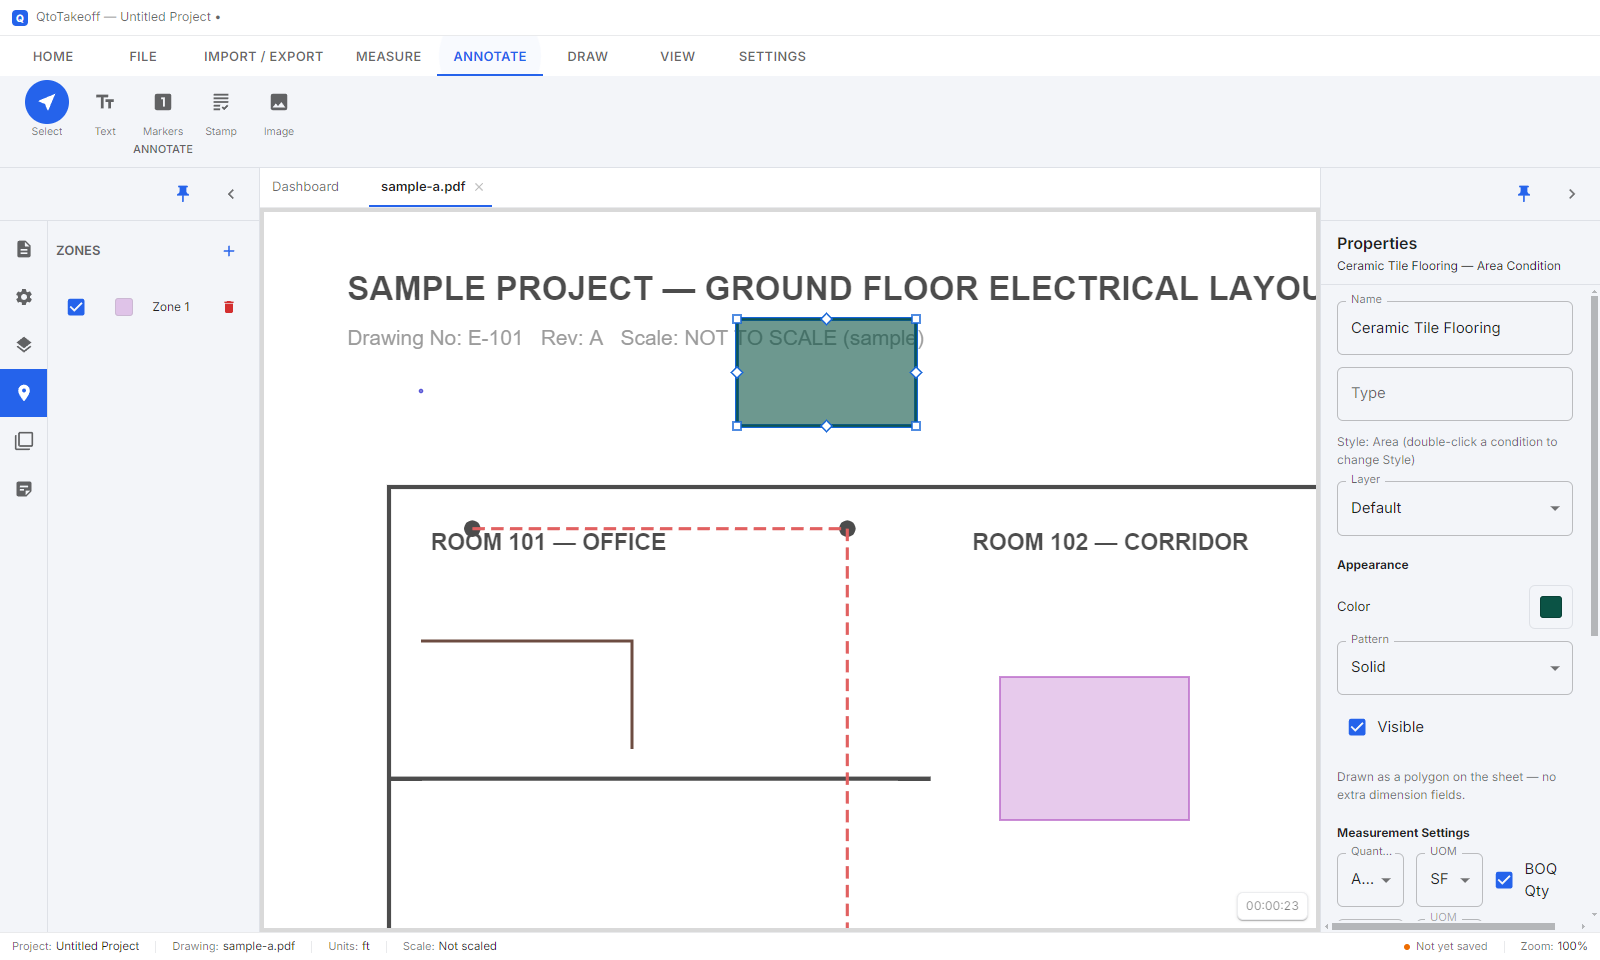
Every annotation type
| Text | Rich text box — bold/italic/underline/strikethrough, alignment, background/border, can also act as a callout with a leader line. |
| Sticky Note | Small colored note icon with editable text and threaded replies. |
| Callout | A leader line from a point to a short text label. |
| Rectangle | Optionally rounded corners, stroke and fill. |
| Ellipse | Stroke and fill. |
| Polygon | Freely-shaped closed multi-point outline, curve-editable. |
| Cloud | Classic scalloped "revision cloud" outline, adjustable arch size, reversible arcs. |
| Highlight Area | Semi-transparent filled region (defaults to 35% opacity). |
| Line | Straight two-point line, optional arrowheads either end. |
| Arrow | Straight two-point arrow, choice of head style, optionally double-headed. |
| Polyline | Open, curve-editable multi-point line. |
| Freehand Pencil | Hand-drawn stroke following your mouse/pen. |
| Highlighter | Semi-transparent freehand stroke simulating a highlighter pen. |
| Stamp | A boxed, pre-styled label (e.g. "Approved") from a built-in library — text and color editable per placed instance. |
| Image | An imported PNG/JPEG/SVG placed and resized on the sheet. |
| Numbered Marker | Small filled circle with an auto-incrementing number. |
| Revision Bubble | Circular outline with a short text/letter label, marking a revision cloud. |
Editing a placed annotation
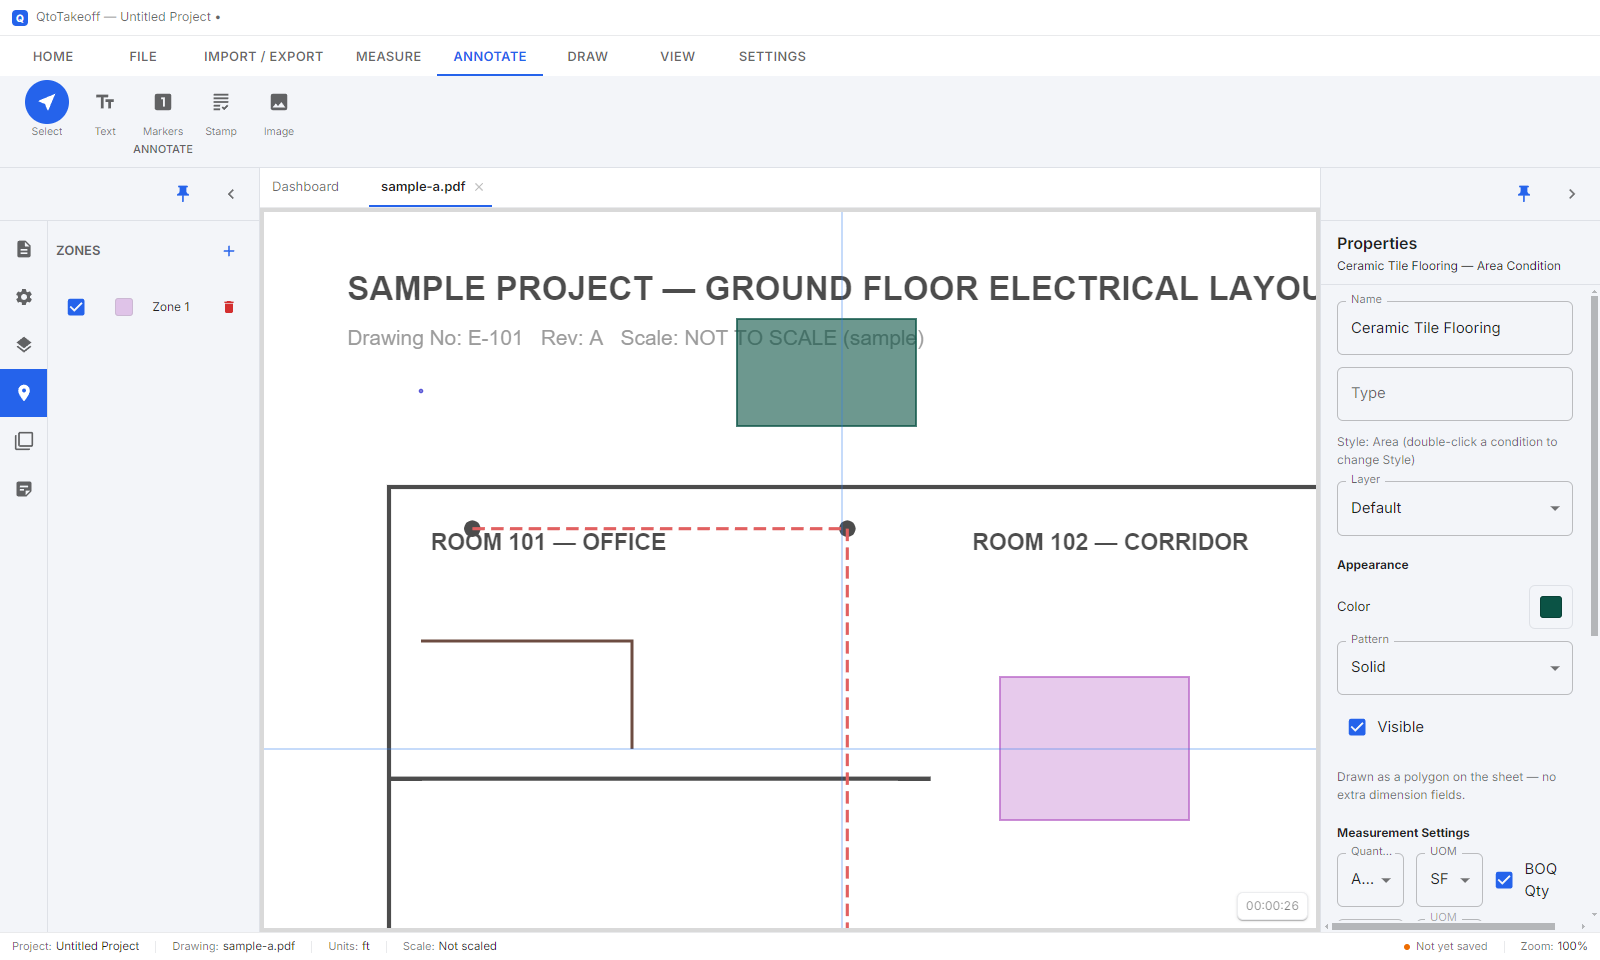
Select it, then use the right-side Properties panel. Every annotation shows: Layer (an Annotation Layer, see Layers), Opacity, Rotation, Locked, and Hidden — plus fields specific to its kind (color, stroke width, font, arrow style, and so on).
17Dimensions
Dimension lines label a real-world distance directly on the drawing — Dimension has its own button in the Annotate group, separate from plain Lines.
- Click the Dimension button in the Annotate group.
- Pick a style from the flyout: Horizontal, Vertical, Aligned, or Angular.
- Click two points (or a vertex + two rays for Angular).
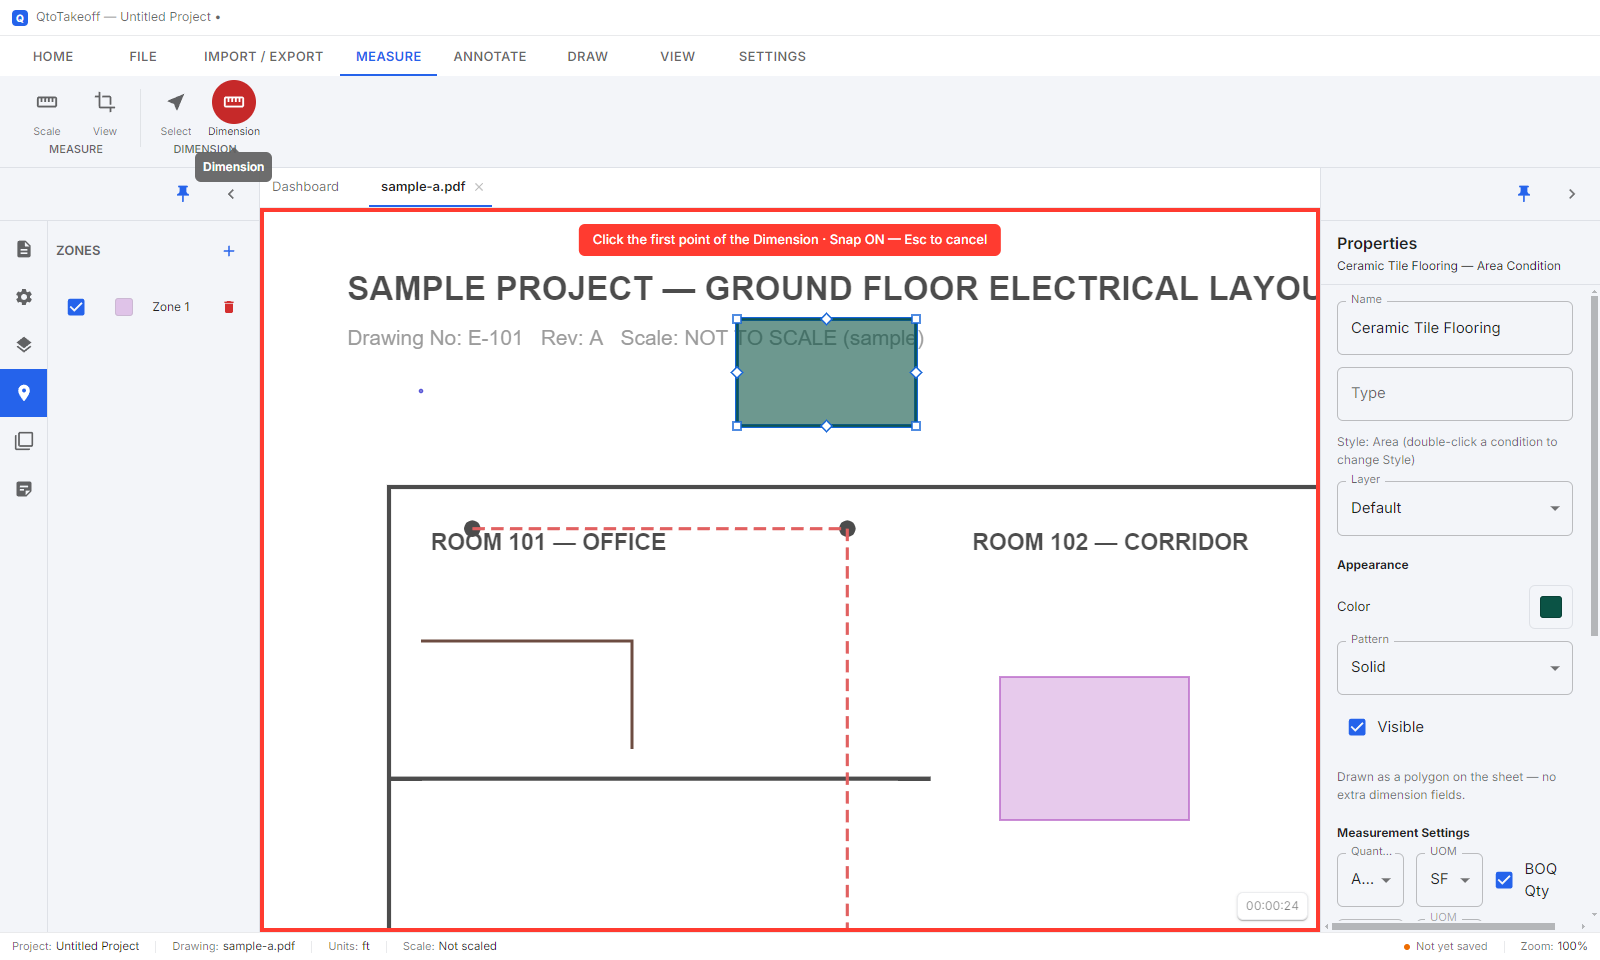
A placed dimension's offset distance from the measured line is draggable, exactly like a CAD dimension.
18Takeoff Summary & Takeoff Workbook
There are two distinct places to see combined quantities, easy to conflate — here's the difference:
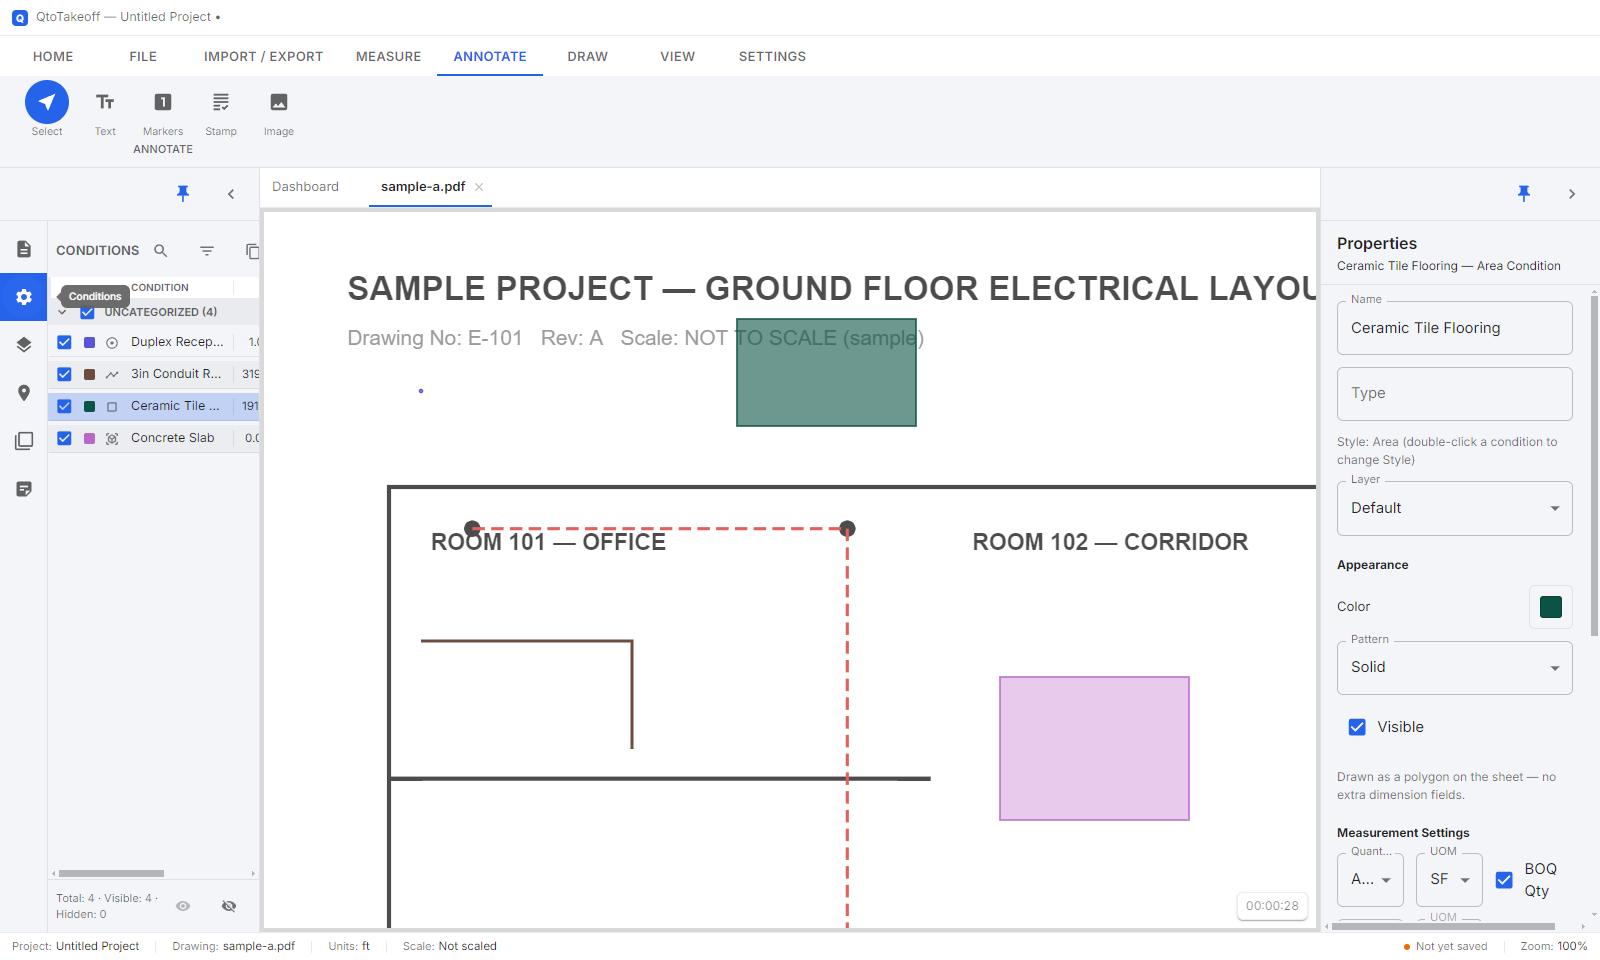
| Conditions panel (left) | Live, editable, sortable, filterable — but scoped to only the currently active sheet, and always grouped by Type. This is what you're watching while actively taking off. |
|---|---|
| Takeoff Workbook (dialog) | Read-only, combined across every sheet in the project. Toolbar → Import/Export tab → Workbook. Offers three groupings: Item (one flat list of every condition, project-wide totals), Sheet (one group per sheet, sheets with nothing measured omitted), and Zone (one group per drawn Zone, plus a "No Zone" catch-all — see Zones). |
19Bill of Quantities (BOQ) ReportEditable · Live Excel formulas
Toolbar → Import/Export tab → BOQ Report opens a full priced Bill of Quantities as its own tab — a printable, spreadsheet-like report built directly from your conditions' BOQ fields, quantities, and rates.
Layout
Columns, left to right: Sr. No. (hierarchical, e.g. 1, 1.1, 1.1.1) · Code · Description · Unit · optional per-sheet quantity breakdown columns (hidden by default, toggle from the report's own Columns menu) · Qty · Rate (Supply / Installation / Total) · Amount (Supply / Installation / Total). Conditions with no BOQ Item No assigned collect into a trailing "Non-BOQ Items" section.
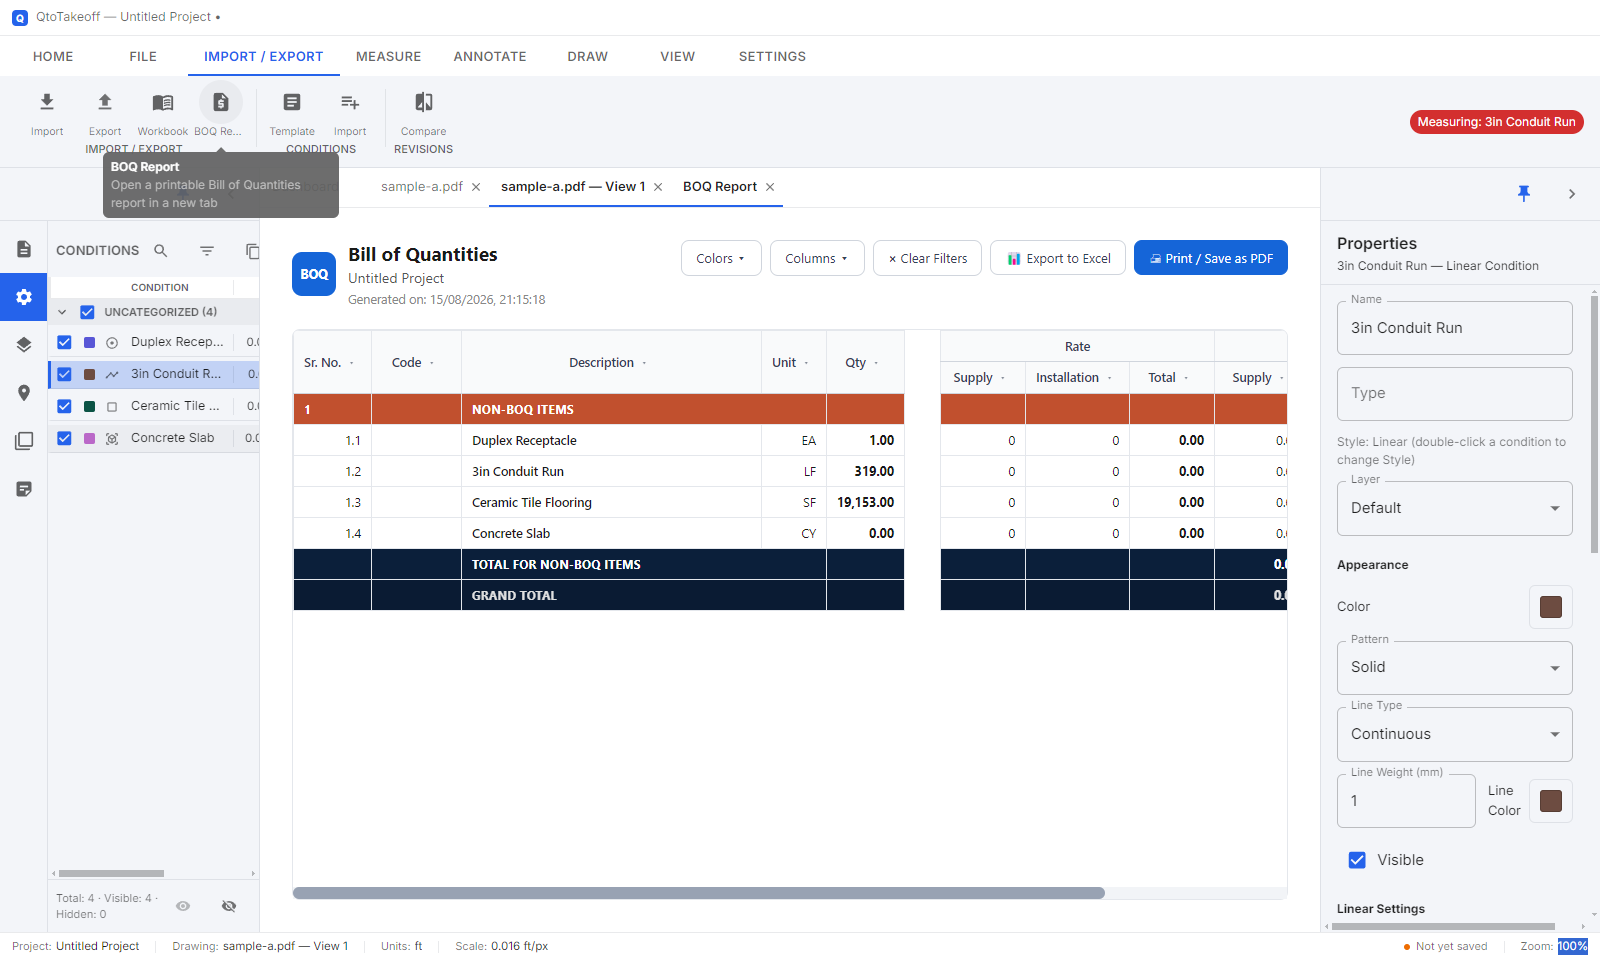
A small illustrative example of the section/total styling once BOQ Item Nos are assigned and rates entered:
| Sr No | Code | Description | Unit | Qty | Rate | Amount |
|---|---|---|---|---|---|---|
| 1. Electrical Works | ||||||
| 1.1 | EL-101 | Duplex Receptacle, Wall Mounted | Nos | 42 | 185.00 | 7,770.00 |
| 1.2 | EL-205 | 3″ Conduit Run, Concealed | LM | 318.5 | 62.00 | 19,747.00 |
| Total for Electrical Works | 27,517.00 | |||||
What's editable, directly in the report
| Code | Free-text, always blank to start — purely manual. |
|---|---|
| Description | Editable inline — for a group with multiple conditions, each sub-row's description is that condition's own Name (editing it renames the condition everywhere). |
| Rate — Supply / Installation | Per-condition cost-per-unit. Type a plain number, or a formula (see below). |
Sr No, Unit, Qty, and every Amount/Total cell are calculated automatically and can't be typed into directly.
Spreadsheet-style editing
- F2 or double-click a cell to start typing; arrow keys move between cells like a spreadsheet; Esc cancels an edit.
- Ctrl+D fills the value from the cell directly above (Code, Description, or Rate) into the selected cell — same as Excel's Fill Down.
- Typing
=120+30or+120+30into a Rate cell is recognized as a formula (basic +, −, ×, ÷ with parentheses) — the calculated result is what's used everywhere, and reopening the cell shows your formula again, not just the number.
Export to Excel
The report's own Export to Excel button produces an .xlsx that mirrors the on-screen report exactly, with real advantages over a flat export:
- Live formulas — every Rate/Amount/rollup cell is a real Excel formula, not a baked-in number. Change a Rate in Excel and every total above it recalculates.
- Cell protection — the sheet is protected; only Code, Description, and the two Rate columns are unlocked and typeable. Every calculated cell is locked.
- Frozen header rows — the two header rows stay pinned while scrolling down. Horizontal scrolling is unrestricted (no columns are pinned left-to-right), matching the on-screen report exactly.
- A column you've hidden on-screen exports as a genuinely hidden Excel column (not omitted), so formulas that reference it still work if you unhide it later.
20Drawing CompareNew
Compares two versions of a drawing — most often an old vs. a new revision — and shows exactly what changed: additions in red, deletions in blue, everything that matched between the two in plain gray. It's reachable two ways, sharing the same review screen:
| From an existing sheet | Sheet Properties → Drawing Source tab → Compare & Replace Drawing.... The current sheet loads automatically as the "before" side; you pick the new PDF as the "after" side. Review, then either Accept Revision (the sheet's drawing actually updates — you'll need to reset its scale afterward) or Decline (nothing changes). |
|---|---|
| Standalone tool | Toolbar → Import/Export tab → Revisions group → Compare. Pick any two PDFs directly — not tied to any project sheet at all. Review, then either Export Comparison... (saves a PDF of the result) or Close. This mode never changes anything in your project. |
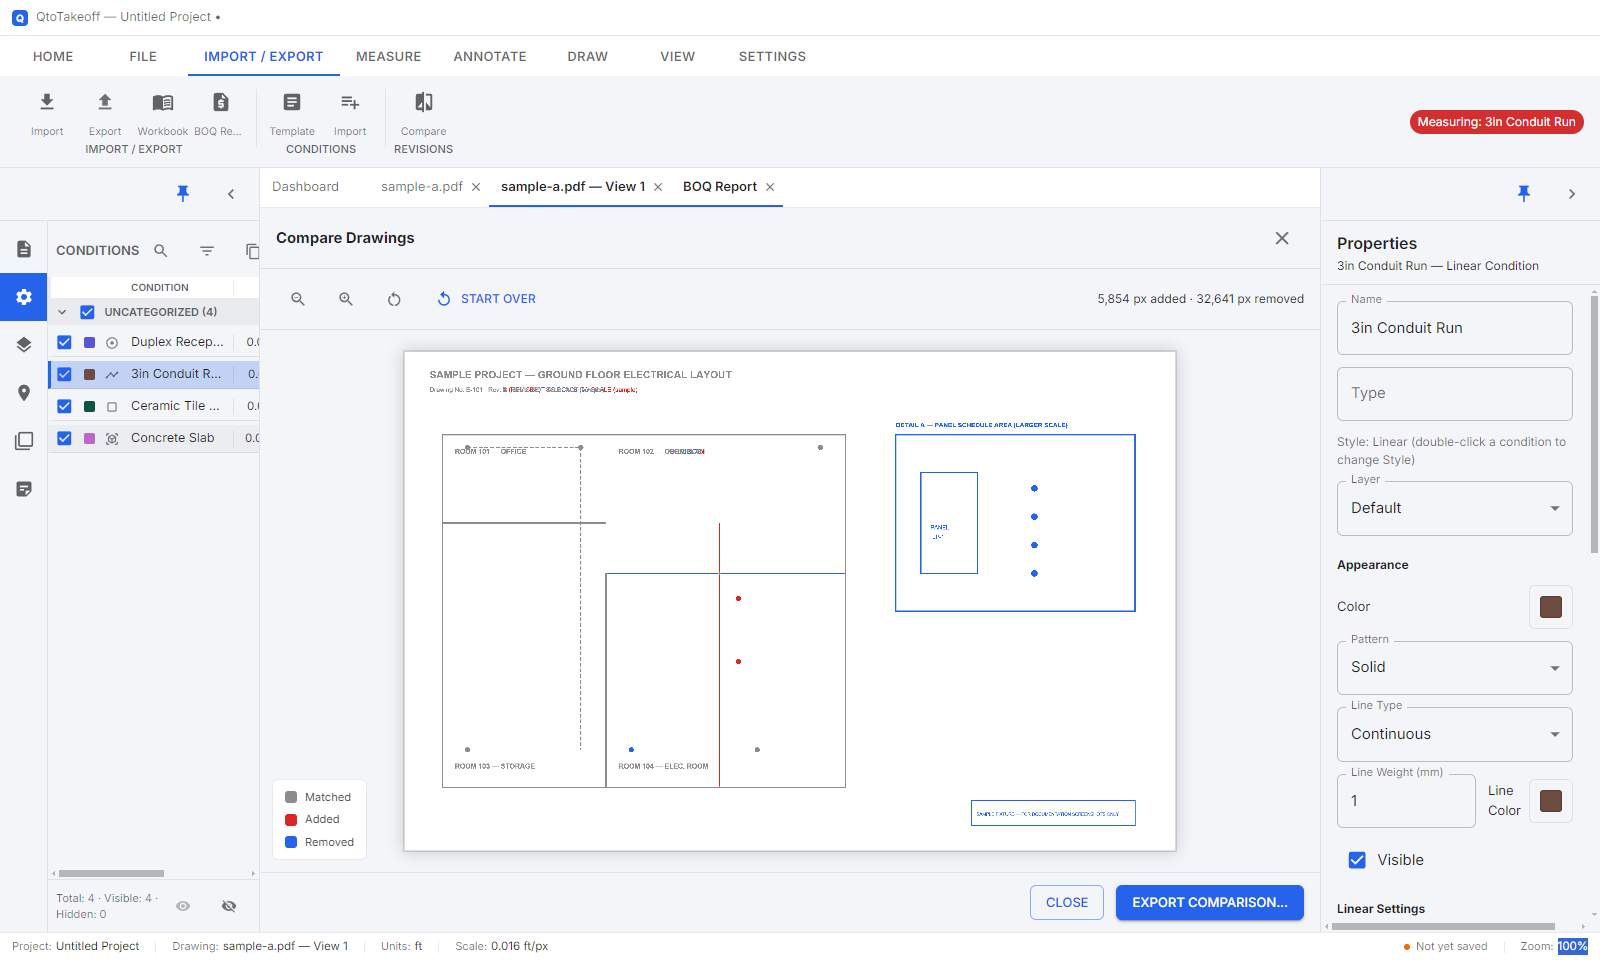
Inside the review screen: an Old/New toggle isn't needed — the comparison image itself already carries both, since matched content is identical regardless of which side you'd be looking at. Pan with left-click-drag or middle-click-drag, zoom with the scroll wheel, and use Start Over to pick different files without leaving the tool. A running count of added/removed pixels gives a rough sense of how much actually changed.
Comparison is computed at full resolution — zooming in shows genuine detail, not a blurred-up approximation. If the two drawings are noticeably different sizes, a warning banner appears, since the comparison may not be spatially aligned in that case.
21Exporting Your Work
Every export format in the app, and where to find it.
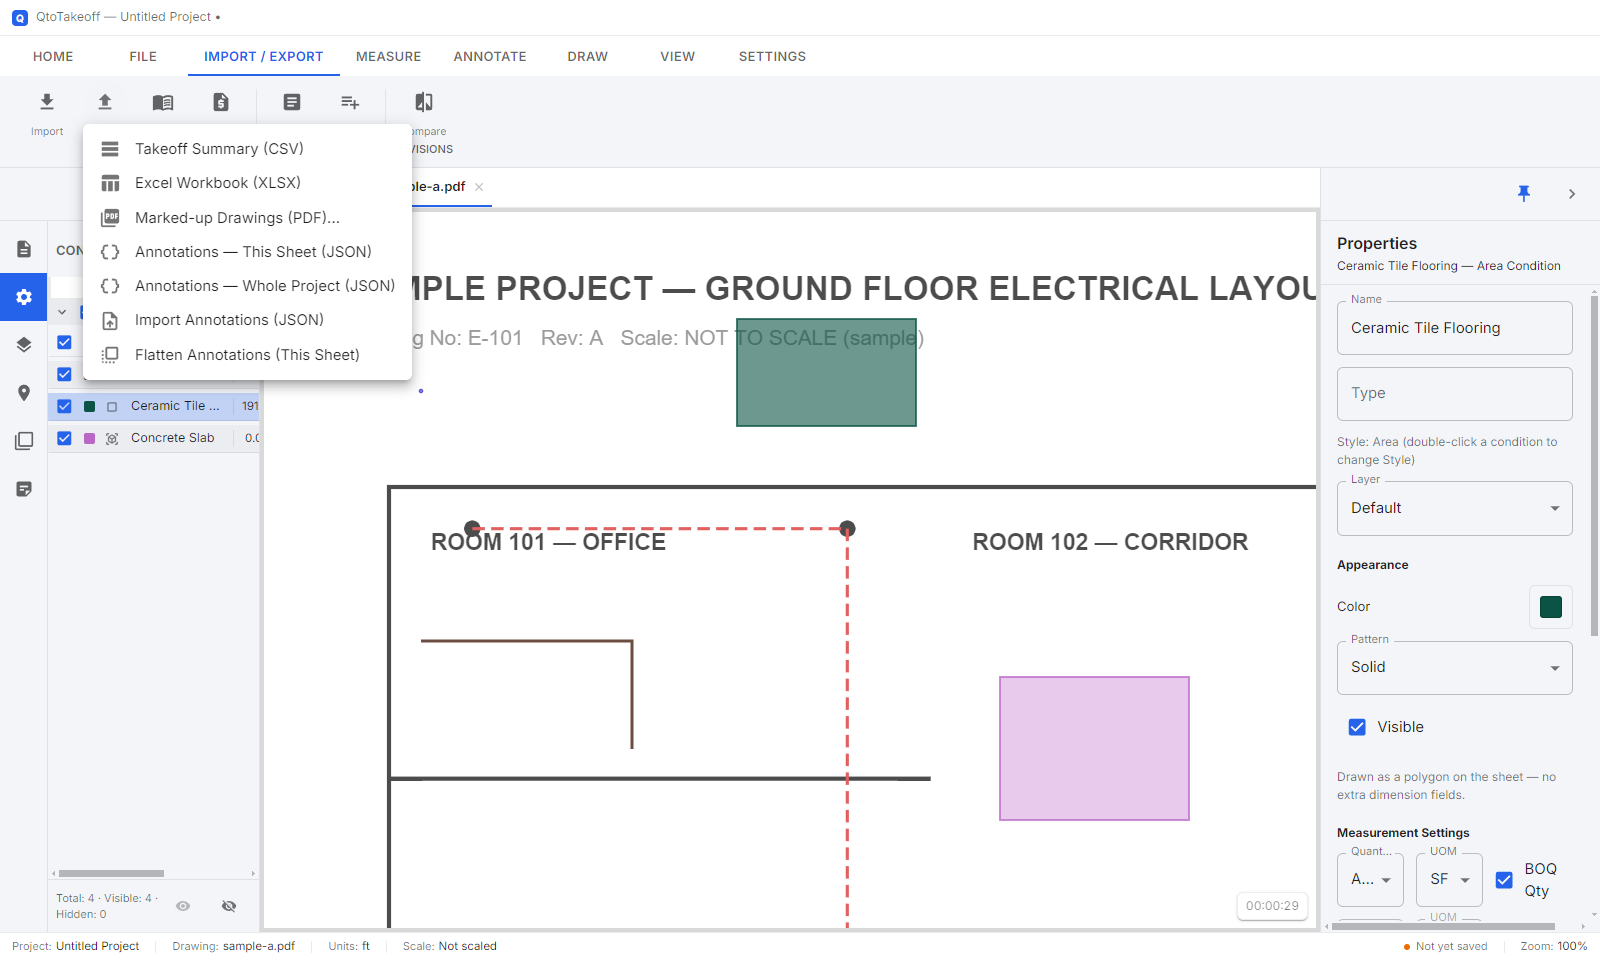
| Takeoff Summary (CSV) | Import/Export → Export menu. A project header block, a Summary table (totals per condition), and a Detail table (every individual item, with its sheet/revision/zone). |
|---|---|
| Excel Workbook (XLSX) | Import/Export → Export menu. Three tabs: Project (cover-sheet metadata), Summary, Detail — same data as the CSV, styled and split across sheets. |
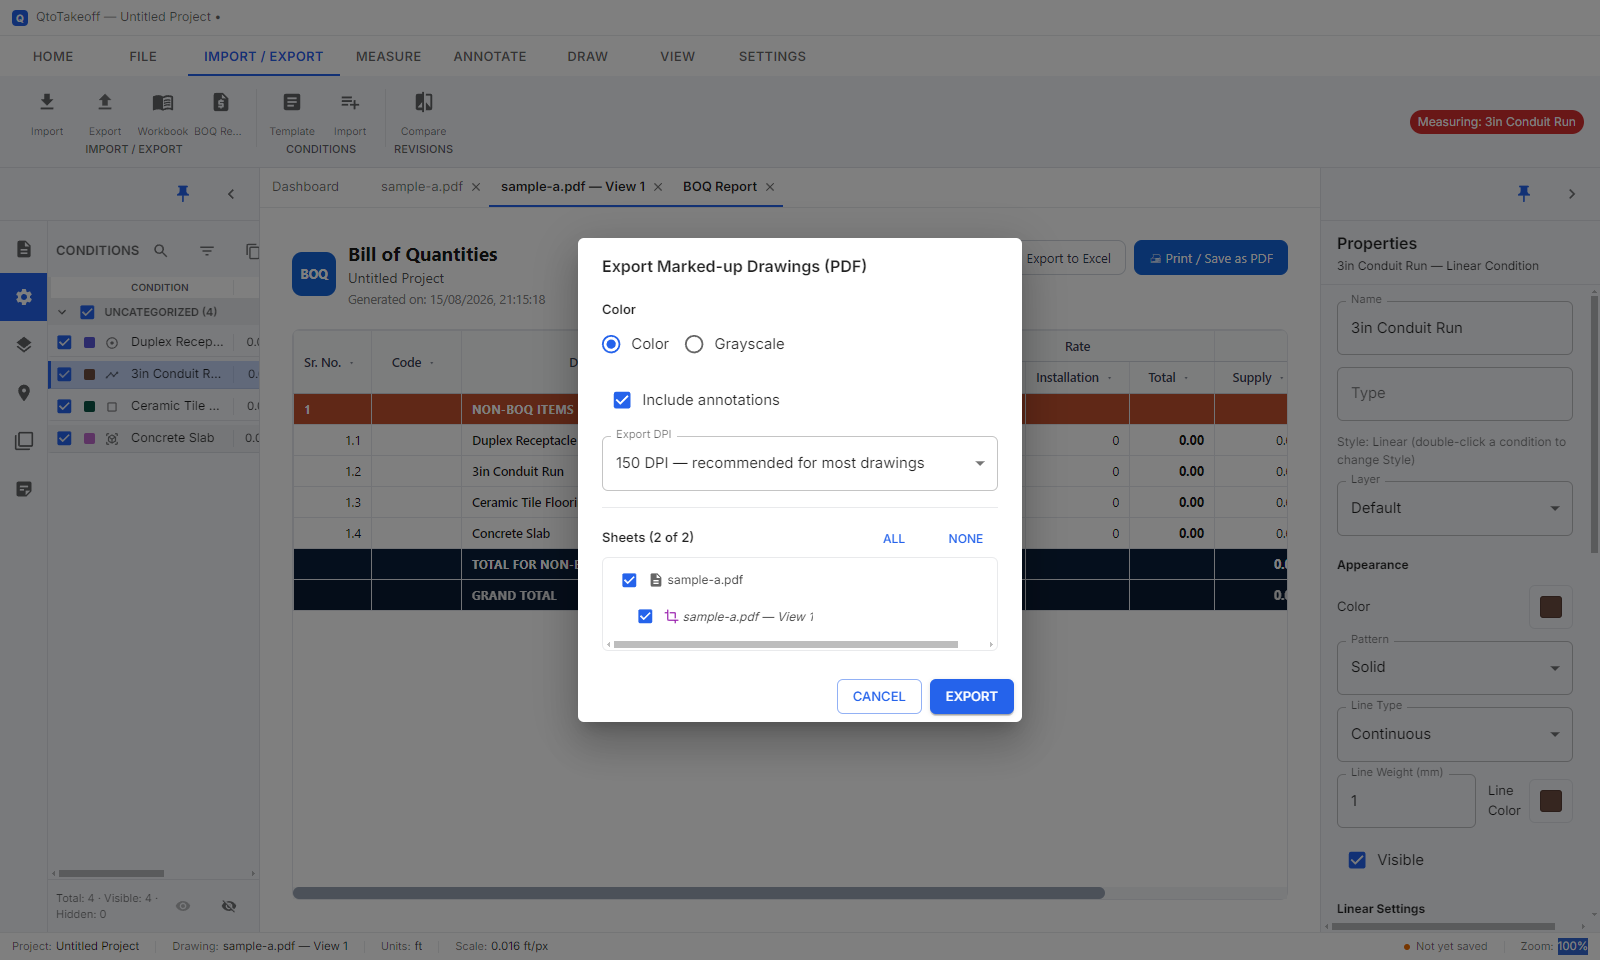
| Marked-up Drawings (PDF) | Import/Export → Export menu. Opens a dialog: Color/Grayscale, "Include annotations", Export DPI, and a checklist of which sheets/views to include (default: all). Produces a PDF with every takeoff item and annotation burned in — and each condition is its own real, independently-toggleable PDF layer in the output, so a reviewer can hide/show one measured condition at a time in a PDF viewer. |
| Annotations (JSON) | Import/Export → Export menu — "This Sheet" or "Whole Project". A portable file of just the markups, re-importable into any project. |
| Flatten Annotations | Import/Export → Export menu — not a file export; permanently bakes the active sheet's annotations into its image (irreversible once saved). |
| BOQ → Export to Excel | Inside the BOQ Report tab. See BOQ Report above for exactly what it produces. |
| Conditions Template / Import Conditions | Import/Export → Conditions group. Download a blank Excel template (with dropdown validation), fill it in, then re-import to bulk-create conditions. |
| Drawing Comparison (PDF) | Inside the standalone Compare Drawings tool. See Drawing Compare above. |
22Saving & Autosave
Your whole project — drawing links, conditions, every measurement, every annotation — lives in one .qtotakeoff file.
- Toolbar → Save (or Ctrl+S) to save at any time.
- Toolbar → Open to pick it back up later — everything is exactly as you left it.
QtoTakeoff autosaves every 2 minutes once a project has been saved at least once (a small "Autosaved" notice appears each time). A brand-new, never-saved project isn't autosaved yet — save it manually once first to turn autosave on for that project.
23Settings
Toolbar → Settings tab → Settings. Everything the app currently exposes:
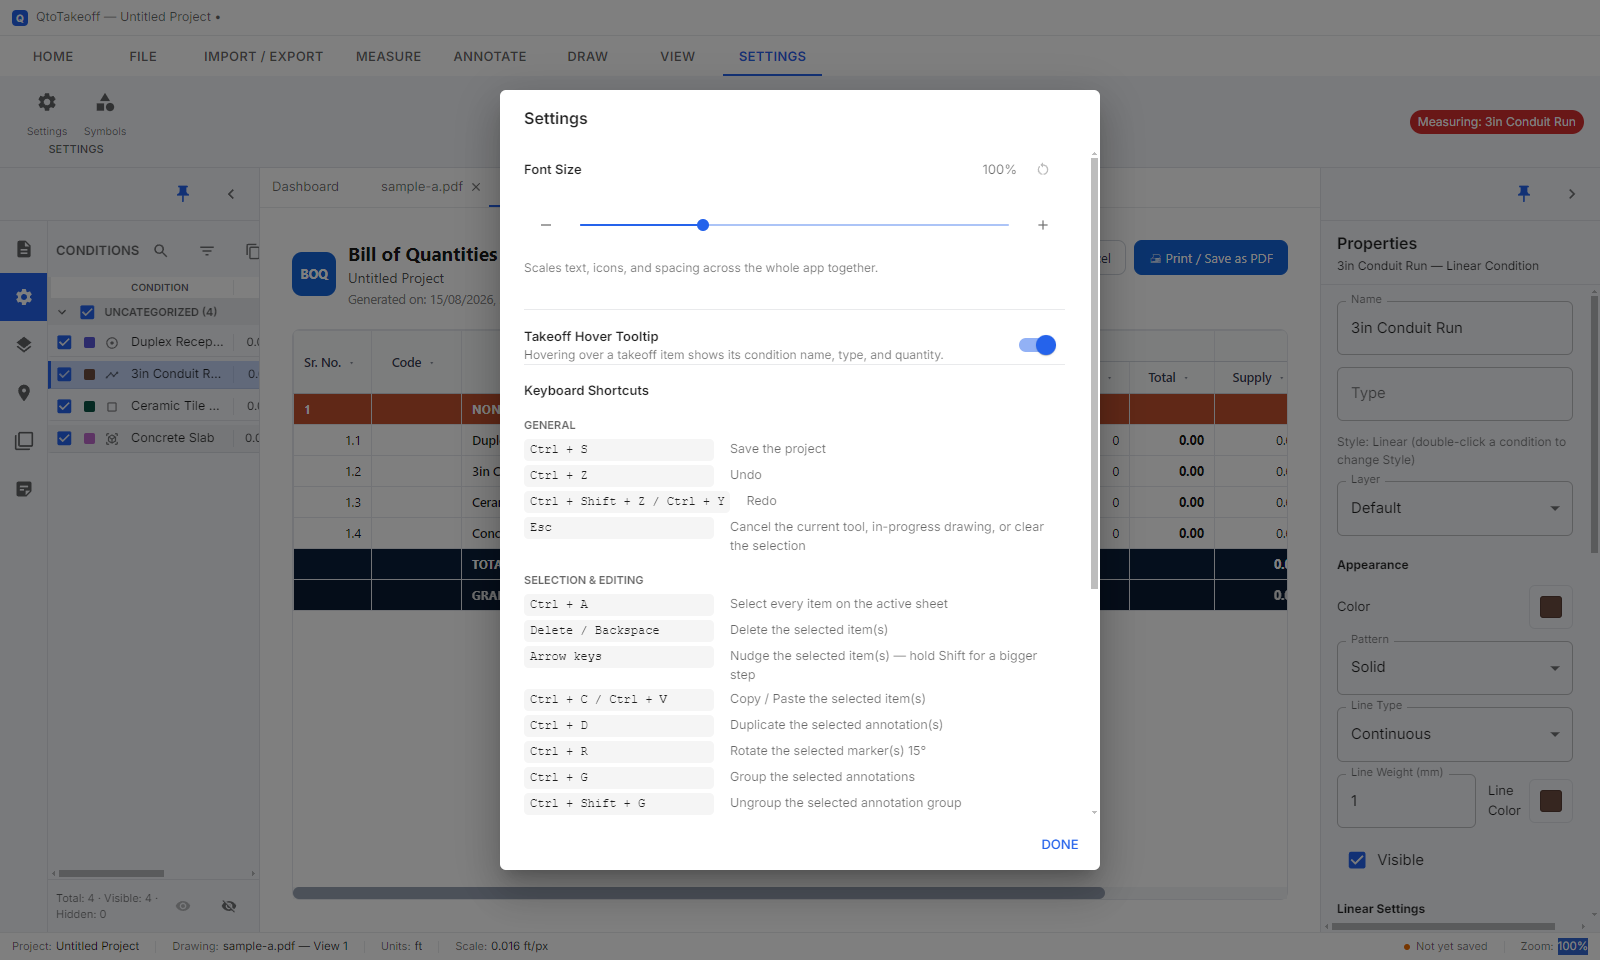
| Font Size | A slider (with −/+ and a Reset button) scaling text, icons, and spacing across the whole app together — uses the OS-level page zoom, not just a CSS font tweak. |
|---|---|
| Takeoff Hover Tooltip | On/off — hovering a takeoff item shows its condition name, type, and quantity. |
| Keyboard Shortcuts | A built-in reference list — see Keyboard Shortcuts below, which is the exact same list. |
24Keyboard Shortcuts
General
| Ctrl+S | Save the project |
| Ctrl+Z | Undo |
| Ctrl+Shift+Z / Ctrl+Y | Redo |
| Esc | Cancel the current tool / in-progress drawing / clear selection |
Selection & Editing
| Ctrl+A | Select everything on the active sheet |
| Delete / Backspace | Delete the selected item(s) |
| Arrow keys | Nudge the selection (hold Shift for a bigger step) |
| Ctrl+C / Ctrl+V | Copy / Paste (Zones excluded) |
| Ctrl+D | Duplicate the selected annotation(s) |
| Ctrl+R | Rotate the selected marker(s) 15° |
| Ctrl+G / Ctrl+Shift+G | Group / Ungroup selected annotations |
Drawing & Measuring
| Enter | Finish a multi-point measurement, zone, or annotation |
| Space | Arm/disarm the last-used condition |
| Shift (hold) | Momentary Ortho — snap horizontal/vertical while drawing or moving |
| Alt + drag a vertex | Pull out a curve handle (Polygon, Polyline, Highlight Area, Zones) |
| Scroll wheel | Zoom, centered on the cursor |
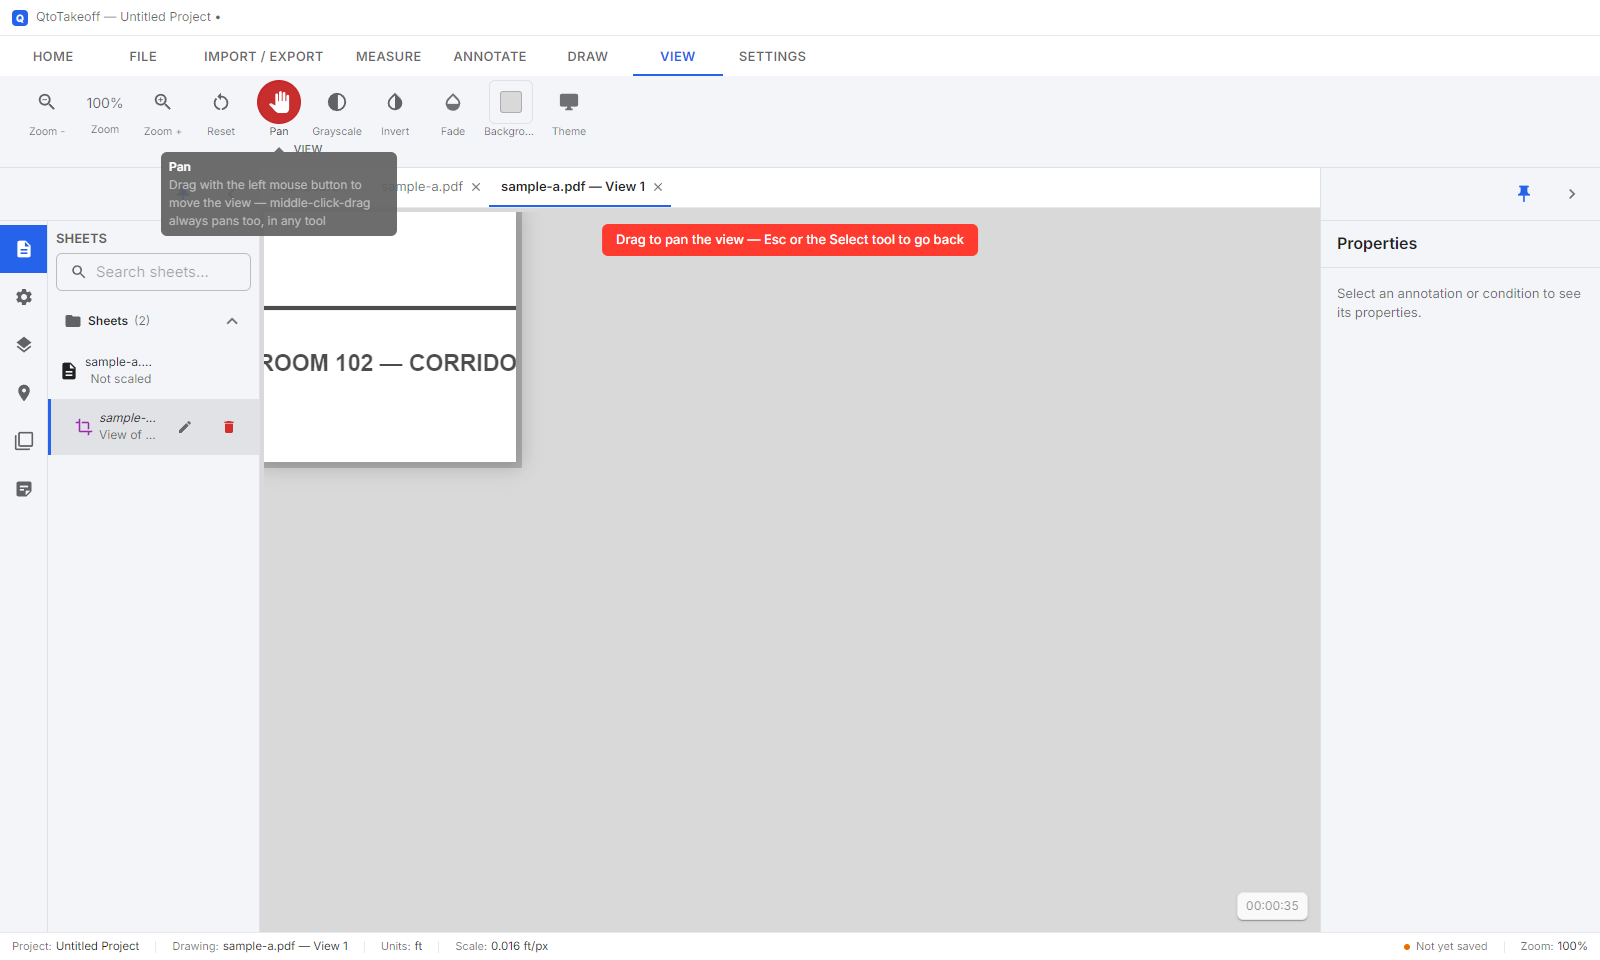
| Middle-click-drag | Pan the view — works in any tool, no need to switch anything |
Toolbar → View tab → Pan arms a dedicated pan tool, so a plain left-click-drag pans too — useful on a mouse/touchpad where middle-click isn't convenient. Press Esc, click Pan again, or pick any other tool to leave it.
Conditions Panel
| F2 | Rename the armed condition |
| Ctrl+A | Select every condition in the list |
| Delete / Backspace | Delete the selected condition(s) |
BOQ Report
| F2 / double-click | Start editing a cell |
| Arrow keys | Move the selected cell |
| Ctrl+D | Fill down from the cell above |
| Esc | Cancel an in-progress cell edit |
25Licensing Reference
See Installing & Activating for the full walkthrough. Quick reference:
| License types | Lifetime (never expires), Annual, Monthly, Trial, or a Custom duration set by your vendor |
|---|---|
| Activation | Fully offline — export a request file (your details + this computer's machine fingerprint) and exchange it with your vendor for a .qtolic license file |
| Hardware tolerance | Survives minor hardware changes (at least 3 of 4 identifying components must still match) |
| Where to check status | File tab → License → License Information |
26Legal — Disclaimer, License Agreement & Privacy Policy
Toolbar → File tab → Legal — reachable any time, showing three tabs.
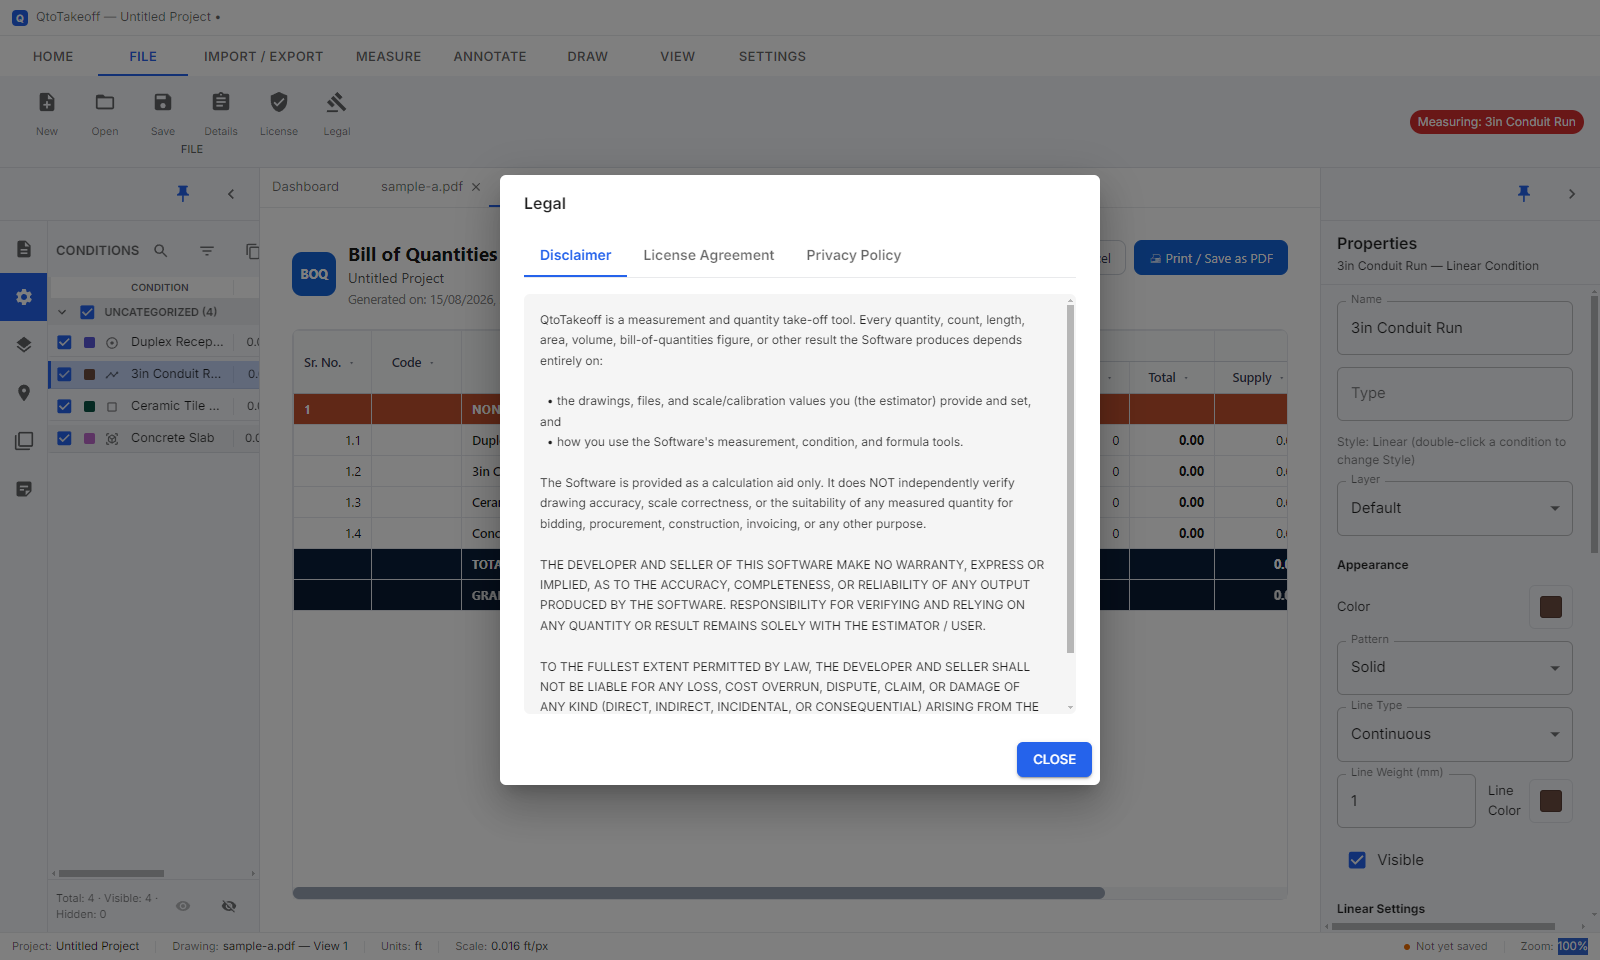
Disclaimer shown every launch
QtoTakeoff shows a disclaimer screen every time it starts, which must be acknowledged before continuing. In short: every quantity, count, length, area, volume, and BOQ figure the software produces depends entirely on the drawings, scale calibration, and inputs you provide — the software is a calculation aid only, and does not independently verify drawing accuracy or the suitability of any result for bidding, procurement, construction, or billing. Responsibility for verifying and relying on any result rests with the estimator.
End-User License Agreement
Accepted once, at installation — covers the license grant (limited, non-exclusive, tied to your license file's seat count), that the software is licensed not sold, restrictions on reverse-engineering/redistribution, the "AS IS" warranty disclaimer, and termination on breach. Reachable again afterward via the Legal dialog above.
Privacy Policy
QtoTakeoff runs entirely on your computer and does not require an internet connection. It does not collect, transmit, or share your project files, drawings, or quantities with anyone. All data stays on your computer, in locations you choose. There is no analytics or tracking of any kind, and license activation itself is fully offline.
27Troubleshooting & FAQ
| A sheet imported but shows as a blank gray box | Almost always a very large sheet imported at too high a DPI. Reopen Sheet Properties → Drawing Source → Render Resolution, and pick a lower DPI, or re-import at a lower DPI from the start. |
|---|---|
| My measurements don't match reality | Re-check Set Scale on that sheet — every quantity is calculated from that one calibration. If it's off, everything downstream is off by the same factor. |
| "License Problem" appears on launch | Read the specific reason shown (expired, wrong computer, damaged file) and re-import a current license file via the same screen. |
| I deleted a condition/sheet and can't undo it | Deleting a sheet or a condition intentionally clears the entire undo history, not just that one action — see the warning in Select, Move & Undo. |
| A BOQ Rate cell shows 0 after I typed a formula | The formula wasn't valid (or evaluated to a negative/non-finite number) and fell back to 0 — reopen the cell and check the arithmetic. |
| Two drawings I'm comparing look almost entirely red/blue even though they're the same | Make sure both were picked at the same DPI setting in the Compare tool's picker — mismatched DPI is handled automatically, but starting from very different DPIs on very large sheets can still reduce precision. |